This thread has been locked.

If you have a related question, please click the "Ask a related question" button in the top right corner. The newly created question will be automatically linked to this question.

ADC12DJ5200RFEVM: Line patterns seen in a 2D histogram obtained from two channel measurements.

Part Number: ADC12DJ5200RFEVM

Tool/software:

Hi all,

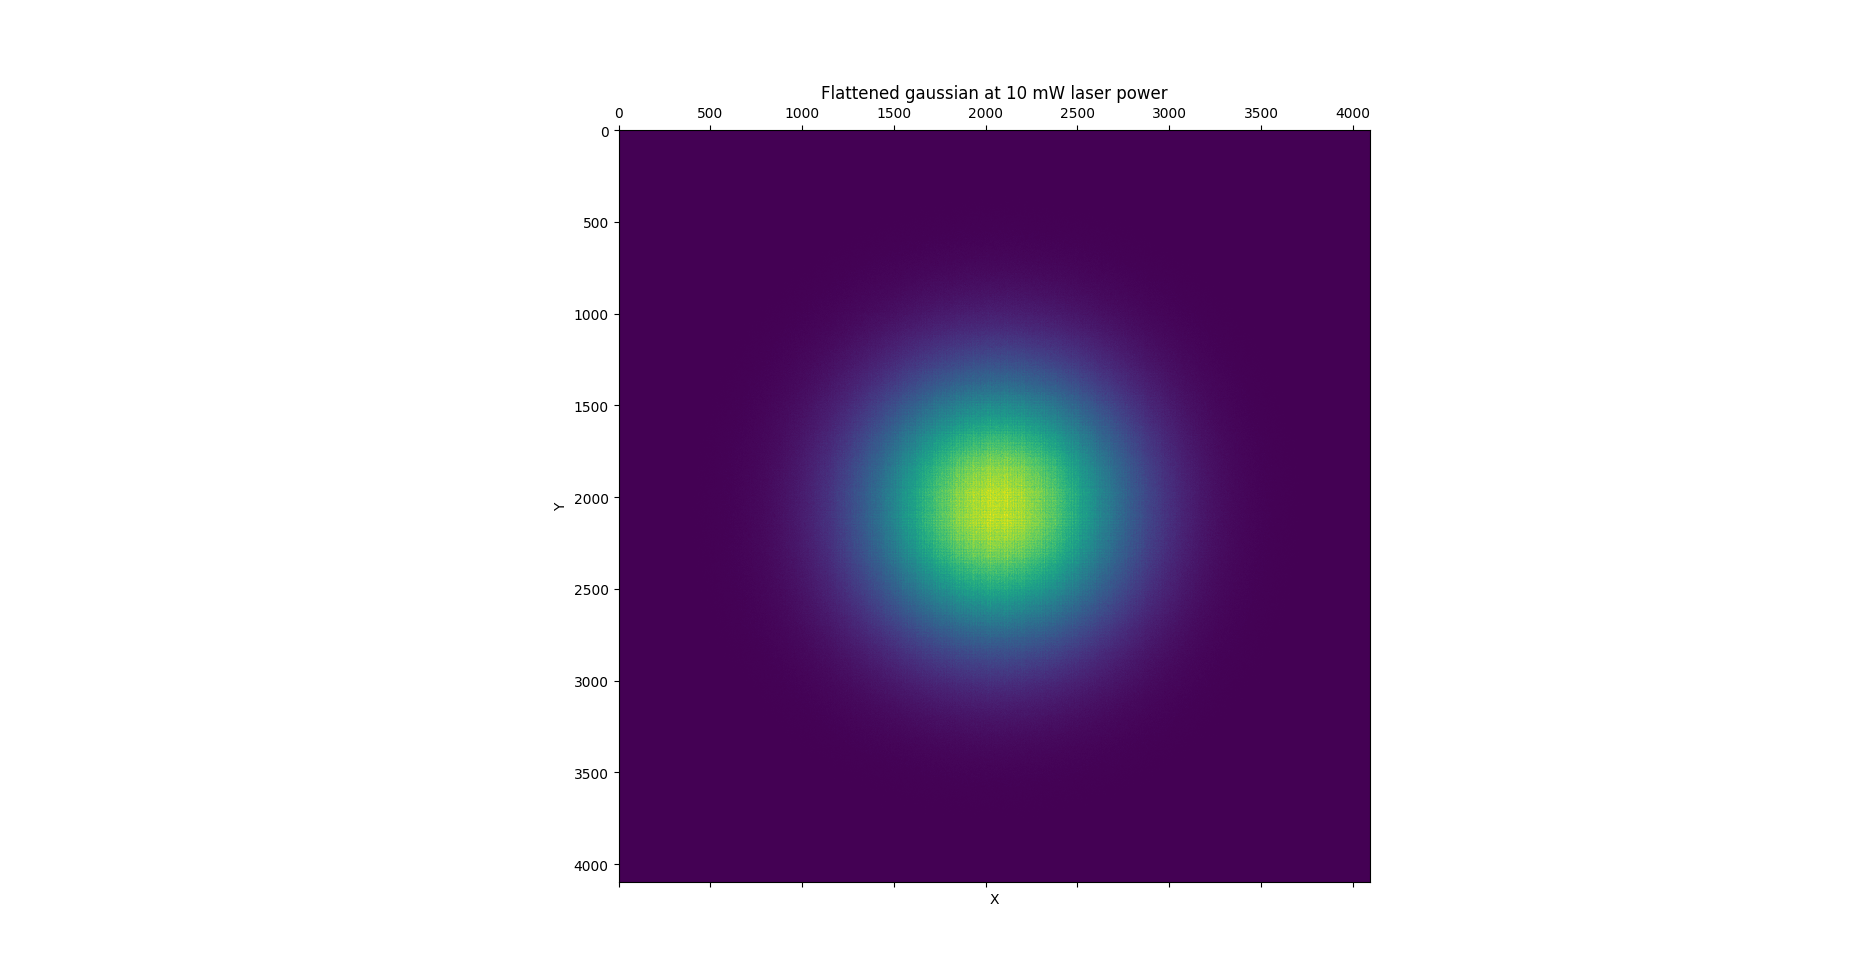
I am currently using the mentioned ADC together with a VCU118 FPGA to develop a quantum random number generator. Part of this is measuring the voltage of two photodiodes and creating a histogram. To be more specific, values are taken from both of the ADC channels and then the values are used as position in a 2D array, where the value at that position gets incremented by one, essentially forming a histogram.

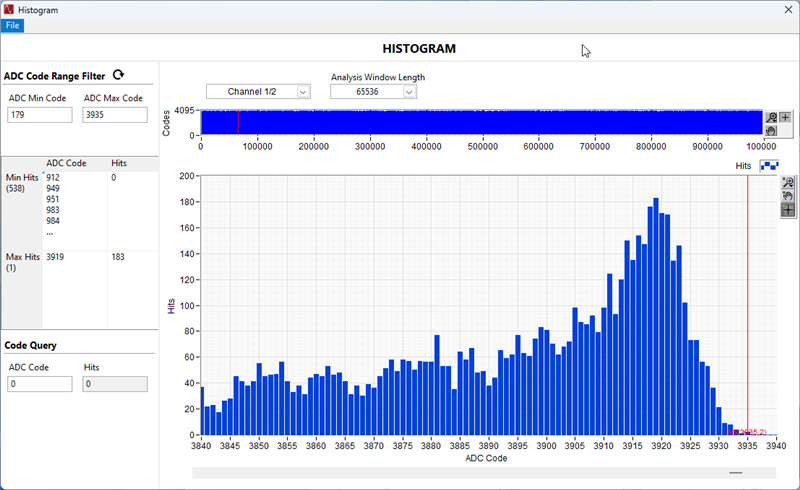
With the current experimental set up, I am expecting to see a Gaussian, which is what I see, however, I am also seeing some lines forming both horizontally and vertically. The lines seem to be roughly spaced by values of 16, which corresponds to 4 bits and as I saw in the datasheet, the ENOB of the ADC is approximately 8 bits. Could this be due to ENOB? I also took the same ADC values, right shifted them by 4 and then plotted the same histogram, at which point the Gaussian looked fine, without any lines.

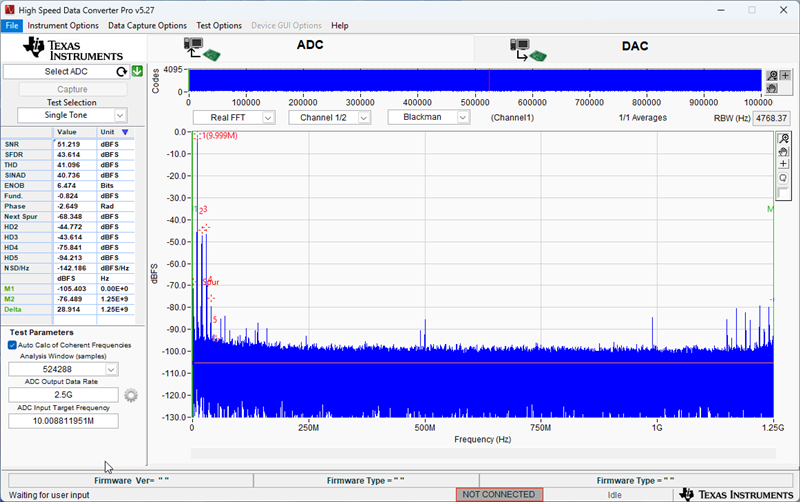
I have checked the transport layer, the data I am receiving looks to be fine without any discontinuities. I am transferring data from the FPGA to the PC over PCIe. The only discontinuities I see in the received signal are caused by PCIe implementation on the FPGA not being completely continuous, however, that should not impact the histogram in any meaningful way. I have also taken a look at the same histogram plot with the ADC connected to sine wave generators, they also showed the same patterned lines.

Please let me know whether this is just an intrinsic quality to the ADC or whether I am doing something wrong. I have attached a picture of the histogram (and a zoomed version) to show the lines. Thank you for the help!

  • Hello Marius,

    Can you just confirm something for me about your plots, I am assuming that if the color is brighter it means that the specific point is getting sampled more often correct?

    If this is the case this could be happening because your input is not coherent to the sampling frequency and you are just essentially sampling the same point of the signal over and over. To fix this try inputting a prime coherent tone to the ADC.

    Best,

    Eric

  • Hi Eric,

    Yes, that is indeed correct.

    I don't think I can make this coherent, if coherency even applies in this case. I am sampling the data from a 1.6 GHz bandwidth photodiode (Thorlabs PDB480C https://www.thorlabs.de/thorproduct.cfm?partnumber=PDB480C-AC). Random light fluctuations are input in to the photodiode so the output of the photodiode should also be random.

    However, I realized another potential problem. I was initially advised to sample the photodiode at 2 times its bandwidth, so as to capture the full frequency spectra. Currently I am sampling at 2.5 GHz. I suppose it could be the case that due to the bandwidth of the photodiode being lower than the sampling frequency, the photodiode may not be quick enough to change the output before the second sample. I will try lower frequency sampling.

    But just to make sure, this should not be caused by some properties of the ADC? I still have that doubt because of the spacing between the lines being 16.

    Thank you for your help!

  • Hi Marius,

    Yes I agree in the random light case this could be an issue but I was wondering if you could try this experiment with a sine wave input to help narrow down the problem.

    This sampling frequency seems like it might be to low for the signal you are trying to sample, if your signal has a 1.6 GHz BW then your sampling frequency would need to at least 3.2 GHz to avoid the signal aliasing across Nyquist zones. (This also assumes that your signal is centered perfectly in the first nyquist zone) I would recommend trying to sample the signal at a much higher sampling rate and post processing the data to only extract data from the band of interest.

    I can not think of any property of the ADC that could be causing these periodic 16 sample lines other then what I have previously mentioned in this post.

    Best,

    Eric 

  • Hi Eric,

    I connected a 200 MHz sine wave with a 50/50 splitter to both of the channels of the board. Unfortunately, it still seems like there's some patterns.

    In regards to the photodiodes, initially I thought that perhaps due to faster sampling in comparison to bandwidth, there's an increased chance of sampling the same value twice. However, I tried to downsample the data and unfortunately there was still the same issue present. I will try higher frequency sampling, but I am not sure how it will help, since I don't think aliasing applies in this case seeing how the output signal is supposed to be random.

    I have attached some images to illustrate. First image is the 200 MHz sine waves without dithering, second image is the same sine waves but with small amplitude dithering, and last image is the photodiodes without dithering, which show even worse results. It seems like dithering also has a significant impact.

    If you have any more suggestions, I am very open to hear them, however, as this is likely not an ADC related problem, I am okay to close this issue as solved.

  • Hello Marius,

    The dither will introduce random noise in the signal to help with spurious content in the spectrum of the signal so I guess it would make sense that turning dither off would make it worse.

    I am still not sure if you can downsample the data as this would cause aliasing across nyquist bands. Although as you point out I am not sure how this would matter since you are trying to capture random data anyways but it is something worth trying I think.

    Best,

    Eric

  • Hi Eric,

    I tried downsampling and also sampling at increasingly higher frequencies. Downsampling did not do much at all whereas higher frequency sampling changes the patters, but they are still there. Anyways, as this is not related to the ADC, I will close the issue. Thank you for you help and patience.

  • Hi Eric,

    Apologies for reopening this thread again, but I have found something which may be of help. Basically, I tested this with different ADCs and different photodiodes. Different photodiodes did not change anything, but different ADCs showed some patterning, but different and less significant, but still there. I did some research about this and found this thread: https://e2e.ti.com/support/data-converters-group/data-converters/f/data-converters-forum/1003029/ads54j60evm-count-spikes-appear-on-histogram-every-3-or-so-bins

    So for comparison, I also did a histogram of a 10 MHz sine wave at 2.5 GHz sample rate and indeed I see a very similar thing. I have included a picture. In the thread they suggest disabling DC offset calibration, I tried both disabling it and enabling it, but it made no difference. Could this be related to DNL/INL? Any suggestions on what could fix this?

  • Quick update, increasing amplitude helps somewhat.

  • Marius,

    Can you send me the raw adc samples with a sinusoid as the input? Also can you share what is the signal generator used for the sinewave input model number? When you provide that info can you also share what JESD mode and the sample rate for the collected data?

    Chase

  • Hi Chase,

    Here is the data link: https://we.tl/t-I2h3dDQsEj

    It is raw binary data in binary offset format. The mode is JMODE3, so the data is from two channels. The data in the raw binary file is interleaved, meaning 12 bits from one channel and 12 bits from the other channel. The sample rate is 2.5 GHz. We resoldered the board for onboard clocking. The synthesizer is Hameg HM 8133-2. The sine wave is 10 MHz with 280 mV amplitude.

    If you need anything else or you want me to convert the data to another format, please let me know.

  • Marius,

    Can you upload to this link instead? IT has blocked your link on my side.

    TI Drive: https://tidrive.ext.ti.com/u/gwVN-ruFTZeRBU39/f6ac0f8c-ec27-46fc-b169-3071a3877b4a?l 

    Access code: vWpCd93|

    Chase 

  • Since you offered, if you can export the data as a csv with two columns of channel A, channel B, that would be quickest on my end. Thanks

  • Hi Chase,

    In case the upload link is time limited, I uploaded the raw data now. As it is quite late here, I cant export CSV data at the moment. However, I will do that tomorrow assuming the link will still work.

  • Hi Marius,

    No worries, the link will be active for up to 30 days. Have a good weekend.

    Chase

  • Hi Chase,

    I uploaded a csv with 10 MB of data, if you need more, let me know.

  • Hi Chase,

    Any clue so far what might be the cause? I am also attaching an image with a histogram when reading from photodiodes, which shows a Gaussian distribution. In this case it is even more apparent.

  • Hi Marius,

    I think what we are seeing here is a combination of the input signal phase noise.

    Looking at the FFT of this data, the signal is near fullscale yielding improved swing and better histogram as you noted before. I can confidently say that this source has high phase noise and also harmonic content. The ADC's HD2 and HD3 spec (at 350MHz, which is the closest I can reference as Eric is out of office) shows -74dBFS and -65dBFS, respectively. The number you are capturing is 30dB and 20dB worse than what the part is spec'd at, which is using as close to an ideal signal generator for clock and input source as possible, at the time, SMA100B with ultra low phase noise option (B711). 

    Zooming in on FFT shows us the phase noise skirt around the 10MHz signal which is adding to the noise near the edges of the histogram as the ADC has frequency content that is drifting, so it may stay at a code just offset from the peak for extra time, and a super deep capture like 2^19 samples really shows it.  

    Another thing to note is this signal is not coherent. If you are supplying an exact 10MHz signal, this is an integer multiple of the ADC sample rate, 2.5G, and the ADC would be sampling the same exact (assuming perfect sources) signal every 2.5G/10M = 250 samples. If you instead supply a signal that is coherent to a 2^19 sample size, then the ADC will sample a unique point along the sine wave for each and every single one of the 2^19 samples. Below is a coherent frequency based on 2^19 samples and around 10MHz. Can you try this new frequency and send a similar amount of data?

    10.008811951 MHz

    Thanks, Chase

  • Hi Chase,

    Thank you for your detailed response! I am not sure if I will be able to set the frequency at such resolution, but I will check tomorrow and record the data.

    On another note, if this is phase noise from the source, why does it also happen when measuring noise from photodiodes, which is random and is supposed to have a gaussian distribution, as I show above?

    Is there a possibility that the phase noise is occurring due to clocking rather than the source input? Why I ask this is because we switched from external clocking to onboard clocking by resoldering the specified components and due to 0201 sizes of the components, the soldering job done may have not been ideal due to lack of proper equipment. Could this potentially cause some sort of reflections on the clock and so in turn cause phase noise on the sampling clock? Is there any way reliable way to check that?

    Also there might be possibility of phase variation due to the way I am transferring data from FPGA to PC. I am using an AXI4Stream interface with a 256 sample deep FIFO to stream the data over PCIe. I noticed sometimes TREADY of the PCIe gets deasserted and so there may be some discontinuities due to that. At some point I will switch the transmission method to assure no discontinuities. However, that would still not explain why the spikes exist with the noise measurements, since the inputs should be random and so neither discontinuities nor coherent sampling issues should affect it. I have uploaded csv data of the samples in question.

    Unfortunately, I do not have any data from when I was using external clocking, since I was only using external clocking only up to the point where I could confirm the JESD link was working.

    Another thing of interest, I have looked at the same things with another ADC (M4i.2234-x8 specifically) and I also saw periodic spikes, just perhaps not as significant. I've also tried other photodiodes and the result was still the same unfortunately.

    Thank you again for your extensive help.

  • Hi Chase,

    I set the frequency to what you asked (not as accurate, it is set to 10.00881195, so missing one digit of precision) and sampled the data again. It indeed does look significantly better, looks like just regular noise at this point. I have uploaded the data to the drive (out_coherent.csv) and here's a screenshot of the histogram:

    Does this mean the same would apply for the photodiodes too, even though the data is random? Would it then be related to their bandwidth? How would I then apply coherent sampling for both diodes when their bandwidth is 1.6 GHz? I suppose then I would need external clocking then? Or could perhaps digital down conversion work?

    Thank you very much for your extensive help.

  • Hi Marius,

    That does look a lot better. I haven’t plotted the data on my side yet but will do that in the next few hours.

    So now, if the photodiode is being excited by random noise, but the ADC is capturing that noise while hitting some few codes more frequently, this makes me think that the random noise may not be that random? How is the light/laser being excited?

    Since the sine wave looks good, I think we can rule out JESD and digital unpacking, etc as the issue.

    The photodiode bandwidth is 1.6GHz while the ADC is sampling at 2.5GHz. The ADC really should be at 3.2GHz or higher in the long term but for now this is ok and won’t cause the 16 sample histogram binning that you see. You can’t consider the data above the 900MHz bin to be correct for now since between 900MHz and 1.25GHz will be first and second nyquist data overlapping.

    Can you connect this signal on a spectrum analyzer and take a long sweep time single shot of the spectrum between DC and 1.6GHz?

    Thanks, Chase

  • Hi Chase,

    To be more specific about the setup, we are doing QRNG based on heterodyne measurements of vacuum fluctuations. So the laser is continuous wave with telecom wavelength, it goes in to a 90 degree optical hybrid, and the outputs from the optical hybrid are connected to two balanced photodiodes. The data is not completely random. The data is distributed in a Gaussian distribution (which is why randomness extraction is needed), so values in the center of the distribution are more likely to occur. However, the order of the data occuring within the Gaussian distribution should be random.

    The only thing I can think of what may make coherent sampling an issue is the rise time of the photodiode, which is related to the bandwidth. It takes finite amount of time, which is possibly somewhat longer than the sampling period of the ADC, for the value on the photodiode to change. Perhaps the issue is in someway related to sampling transitionary values. But I am not sure honestly.

    I have in fact tried increasing the sampling frequency to 3.2 GHz and the line patterns were still there. I also tried increasing to the maximum of 5.2 GHz and they were still there. However, they did seem to change, specifically their periodicity, which could also indicate towards coherent sampling issue. Unfortunately, I do not have that data right now, but if needed, I can acquire it tomorrow.

    I will also investigate the outputs of the photodiodes with a spectrum analyzer tomorrow. Could you just please elaborate what do you mean by a long sweep time single shot? I cannot change any characteristics of the inputs to the photodiodes, so I am not sure what do you mean by sweeping.

  • Hi Chase,

    Here is the output from the spectrum analyzer at the asked frequencies:

    Here's also a spectrum up to 3.2 GHz, just in case: