This thread has been locked.
If you have a related question, please click the "Ask a related question" button in the top right corner. The newly created question will be automatically linked to this question.
Tool/software: Code Composer Studio
In CCS7.4 the C/C++ indexer progresses very slowly and freezes the GUI at times. I have to force terminate CCS to have it respond.
I have tried all the suggestions online (new workspace, clean workspace by deleting metadata folder, CCS with --clean option) but it still occurs. This has been happening to me for a while, so I upgraded to a new computer with windows 10 and the problem still occurs, even with a fresh install of everything.
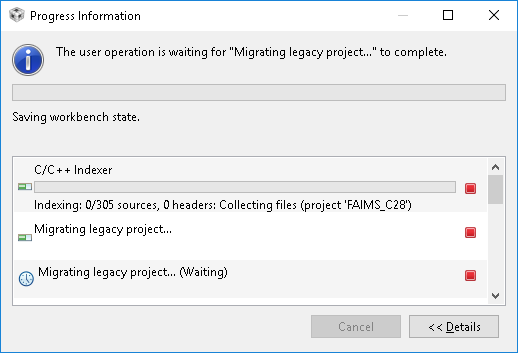
It will sit like the following image for a while, and then may index another file, on the time scale of minutes.
I cannot even disable the indexer because as soon as I start up CCS, it tries to run the C/C++ indexer and freezes everything.
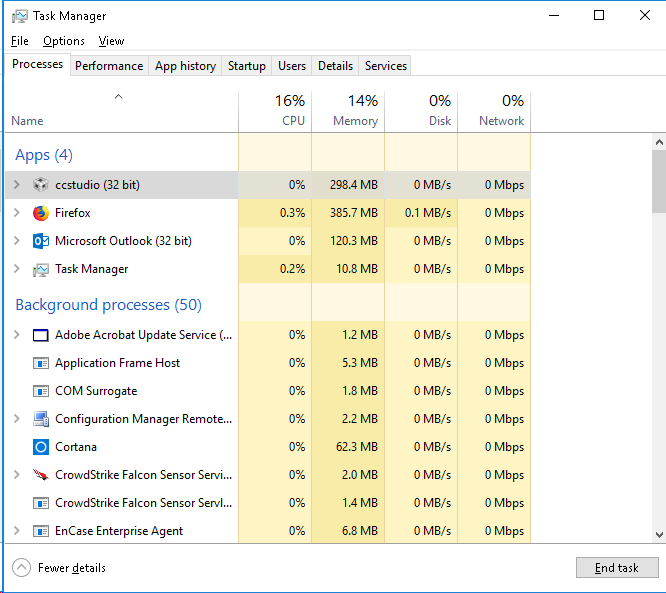
I see almost no CPU/Disk usage for CCS, even though the GUI is unresponsive.
Details:
Windows 10 Pro (10.0.14393 Build 14393)
CCS 7.4.0.00015
Ti Compilers 16.9.3 LTS
TI RTOS C2000 2.16.01.14
controlSUITE f28m36x v207
Derek, John,
Sorry to hear of these issues. Too many people are running into this to call it a corner case. Any additional data you can give us about your environment would be appreciated to help us investigate this further.
Some additional data would be:
-System specs (OS, RAM, processor)
-number of (open) projects in the workspace and approx. size of projects (number of source files)
-heap usage at the time of slowdown (https://e2e.ti.com/support/development_tools/code_composer_studio/f/81/t/200925 )
Thanks
ki
Ki,
The link for heap usage is a 404.
Windows 10, 32-GB, Xenon E5-1620 @ 3.7 Ghz (4 phys, 8 logical cores)
I had 4 projects open, with about ~300 source files in total. I use MWare, TI-RTOS, and the NDK in my projects, no third party libraries.
Of course the issue isn't happening at this point of time, but next time I see i will get the heap usage.
Derek
Hello Ki-Soo,
I've disabled the indexer - and really don't want to enable that - but here's the settings you've asked for:
From Computer that I'm using:
From eclipse.ini file - note - I have not changed or edited this file:
startup
plugins/org.eclipse.equinox.launcher_1.3.0.v20140415-2008.jar
--launcher.library
plugins/org.eclipse.equinox.launcher.win32.win32.x86_1.1.200.v20140603-1326
-vmargs
-Xms40m
-Xmx512m
-Dtirex.viewPackage=controlSUITE
-Dtirex.xmlPaths=../~cs_desktop/controlSUITE/resource_explorer_controlSUITE.xml
And here's a screen shot of the project I'm working on - I only had this one open:
But, a quick history:
The project started using the usb_dev_serial example provided by TI - I really didn't notice much of a slow-down then.
I added the following - and progressively; the workspace and the performance of the TI Debugger and IDE (eclipse I suppose); got slower:
GPIO (using the toggle example)
ePWM
SPI
HRCAP
Most, if not all, of that was following the example code in the latest C2000-Ware - version 1.00.003.00 - which is the latest at this time.
The debugger, when trying to enter a breakpoint - was practically grinded to a halt.
Regards,
John W.
Ki,
Ok - followed the link - look at the attached - all I was doing was running the debugger - tried just to highlight some code and then just tried to add a breakpoint. Debugger slows down significantly just doing these basic things. File is 7zipped.
Thanks,
John
Hi John,
Thanks for the stack dumps. Looking at them, it seems that the Stack Usage view is consistently busy updating itself. Could you try closing the Stack Usage view, and see if performance improves during this same scenario? Just to help isolate the problem.
Thanks,
- Baltasar
Thanks, and if you do see any unexpected slowness, please do generate the thread stack dumps and we'll investigate.
Also, FYI, a couple of real issues were recently fixed in the Stack Usage view. The fixes will be available in the upcoming CCS v8.0.0 release:
Thanks,
- Baltasar