This thread has been locked.
If you have a related question, please click the "Ask a related question" button in the top right corner. The newly created question will be automatically linked to this question.
Tool/software: TI-RTOS
XDCtools 3.32, SYS/BIOS 6.46, CCS 7.4, PDK 4.0.7, NDK 2.25
I’ve got two EVMs connected via TCP. On the EVM server I’ve got socket options set for SO_SNDTIMEO and SO_RCVTIMEO of five seconds. I never send anything to this socket but the EVM server sends data out the socket to the client.
I’ve got a Windows10 application that acts like a client to this EVM server and it works as expected. The EVM server sends data out the port and the Win application gets it.
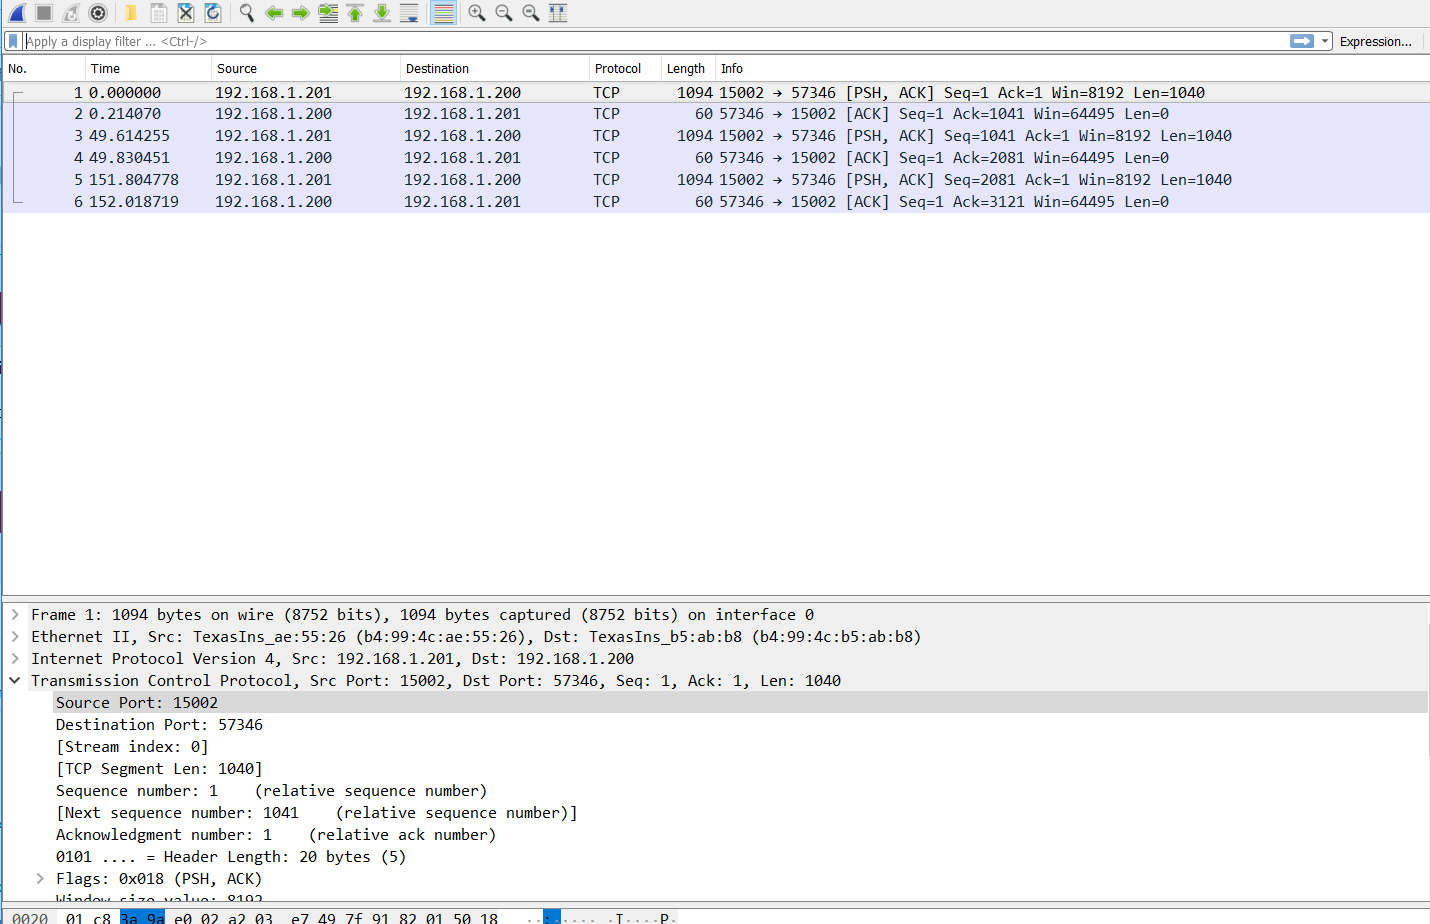
If I replace the Win10 client with the EVM client I have a problem if the data sent from the EVM server is ‘large’. I’ve only got two data points for reference to define ‘small’ and ‘large’; ‘small’ is a stream of 296 bytes and ‘large’ is a stream of 10912 bytes. When I send a ‘large’ stream from the EVM server to the EVM client, the client recv() returns -1 and fdError() gives 54, ECONNRESET. If I send ‘small’ streams of data I get it without and recv() errors.
I am using the Legacy Non-BSD Sockets Interface. I have socket options on the client socket of:
int option = 1; int len = sizeof(option); setsockopt( clientS_, SOL_SOCKET, SO_KEEPALIVE, &option, len ); option = rcvBufSz; setsockopt( clientS_, SOL_SOCKET, SO_RCVBUF, &option, len ); option = sendBufSz; setsockopt( clientS_, SOL_SOCKET, SO_SNDBUF, &option, len );
where rcvBufSz is currently set to 65535 and the sendBufSz is set to 8192.
Any ideas of things I should check?
Mike
I see in the NDK API the following:
CFGITEM_IP_SOCKTCPTXBUF TCP Transmit allocated buffer size
CFGITEM_IP_SOCKTCPRXBUF TCP Receive allocated buffer size (copy mode)
CFGITEM_IP_SOCKTCPRXLIMIT TCP Receive limit (non-copy mode)
I am setting all these in my Network_stack task using CfgAddEntry() following the example NIMU_emacExample_EVMK2H_armBiosExampleProject.
When I set my socket options using SO_RCVBUF and SO_SNDBUF (as I show above), am I overriding the values I set in the configuration with CFGITEM_IP_SOCKTCPTXBUF and CFGITEM_IP_SOCKTCPRXBUF?
I am receiving (trying to receive) using recv(). I'm assuming that CFGITEM_IP_SOCKTCPRXLIMIT does not play a role in this operation. Is that correct? Is/are there some other limit(s) that I need to be aware of?
Here is my _ipcfg as captured after hitting a breakpoint and copied from the debugger Expressions tab:
_ipcfg struct _ipconfig {IcmpDoRedirect=1,IcmpTtl=64,IcmpTtlEcho=255,IpIndex=3342,IpForwarding=0...} 0x800F2698 IcmpDoRedirect unsigned int 1 0x800F2698 IcmpTtl unsigned int 64 0x800F269C IcmpTtlEcho unsigned int 255 0x800F26A0 IpIndex unsigned int 3342 0x800F26A4 IpForwarding unsigned int 0 0x800F26A8 IpNatEnable unsigned int 0 0x800F26AC IpFilterEnable unsigned int 0 0x800F26B0 IpReasmMaxTime unsigned int 10 0x800F26B4 IpReasmMaxSize unsigned int 3020 0x800F26B8 IpDirectedBCast unsigned int 1 0x800F26BC TcpReasmMaxPkt unsigned int 2 0x800F26C0 RtcEnableDebug unsigned int 0 0x800F26C4 RtcAdvTime unsigned int 0 0x800F26C8 RtcAdvLife unsigned int 120 0x800F26CC RtcAdvPref int 0 0x800F26D0 RtArpDownTime unsigned int 20 0x800F26D4 RtKeepaliveTime unsigned int 120 0x800F26D8 RtArpInactvity unsigned int 3 0x800F26DC RtCloneTimeout unsigned int 120 0x800F26E0 RtDefaultMTU unsigned int 1500 0x800F26E4 SockTtlDefault unsigned int 64 0x800F26E8 SockTosDefault unsigned int 0 0x800F26EC SockMaxConnect int 8 0x800F26F0 SockTimeConnect unsigned int 80 0x800F26F4 SockTimeIo unsigned int 0 0x800F26F8 SockTcpTxBufSize int 32768 0x800F26FC SockTcpRxBufSize int 65535 0x800F2700 SockTcpRxLimit int 8192 0x800F2704 SockUdpRxLimit int 8192 0x800F2708 SockBufMinTx int 2048 0x800F270C SockBufMinRx int 1 0x800F2710 PipeTimeIo unsigned int 0 0x800F2714 PipeBufSize int 2048 0x800F2718 PipeBufMinTx int 256 0x800F271C PipeBufMinRx int 1 0x800F2720 TcpKeepIdle unsigned int 72000 0x800F2724 TcpKeepIntvl unsigned int 750 0x800F2728 TcpKeepMaxIdle unsigned int 6000 0x800F272C IcmpDontReplyBCast unsigned int 0 0x800F2730 IcmpDontReplyMCast unsigned int 0 0x800F2734 RtGarp unsigned int 0 0x800F2738 IcmpDontReplyEcho unsigned int 0 0x800F273C UdpSendIcmpPortUnreach unsigned int 1 0x800F2740 TcpSendRst unsigned int 1 0x800F2744 SockRawEthRxLimit int 8192 0x800F2748
I am still in dire need of help with this issue.
I tried other data transmission sizes. If I send 1040 bytes it works. If I try to send 2064 the connection resets. Below is a Wireshark capture of the failure. IP x.x.x.201 is the EVM server trying to send the data and x.x.x.200 is the EVM client. The client's recv() call fails with -1 and fdError() gives the 54 reset indication. I note that Len=1460 and not the 2064 that I am trying to send. A hint? I also see that the first transmission is tagged with [ACK] where as when I reduce the data getting sent that first transmission is tag with [PSH, ACK]. I have a capture below of sending data that is 1040 bytes and that is working.
Other notes, on the failure capture, after my client gets the reset, it closes the socket, opens a new one and does another connect. The EVM server detecting the connection sends an initial 'hello' message which is received by the client OK. This 'hello' message is 296 bytes and is at No. 19 with the client EVM ACKing in No. 20. No.21 is the next time the server EVM tries to send the 2064 bytes and the failure sequence repeats.
Below is capture of failure:
And below is a capture of a successful send of 1040 bytes:
More debug info: Looking at my _ipcfg data I see the MTU is 1500. So I set the amount of data to send such that it would fit into a single transmission unit. In the capture below I am sending 1444 bytes. Now the EVM at x.x.x.201 send a [PSH, ACK] with all the data yet the EVM at x.x.x.200 still does not ACK and eventually gets the connection reset.
Mike
Mike,
Would you attach the wireshark capture file so we can inspect it.
Using setsockopt() to set the SO_RCVBUF and SO_SNDBUF options will override the configuration values for that socket. The _ipcfg values are used as a default when creating new sockets.
The TCP TX/RX buffers are used as holding buffers for outbound and inbound data. They should not effect the actual transmission buffer sizes as this is controlled by the lower layers. But its good to make these as large as possible. Given that the network task runs at high priority, it would be good to have buffers large enough to hold the entire transfer. After the transfer completes, the network task would block (while the network is idle) and the application task would
run and process the received data.
You probably already know this, but just to cover the bases, I wanted to mention that send() and recv() must always be called in a loop. They will return the number of bytes sent/received, which might be less than the requested amount, in which case you would recompute the number of bytes remaining and call the function again.
Stepping back a little, you indicate all is well when using a PC on the receiving side, but it breaks when using the EVM on the receiving side. Have I got this correct? One though comes to mind regarding scheduling. On Windows, the scheduler uses time-slicing, so all threads get to run (some more than others). But on the EVM, you are using SYS/BIOS which is an RTOS that uses strictly priority scheduling. If the priorities are not correct, a task may be starved and be prevented from responding or consuming data. Maybe you have some thoughts on this.
~Ramsey
Mike,
It might become necessary to instrument the NDK source code to narrow down the failure point. Here are some instructions in case you want to go down this path.
I'll assume you have installed Processor SDK RTOS K2HK 4.01.00.06 into <Processor SDK> folder.
First step is to make a backup copy of your NDK install. Make a copy of the following folder.
<Processor SDK>/ndk_2_25_01_11
Edit ndk.mak and specify the install path for XDC_INSTALL_DIR, SYSBIOS_INSTALL_DIR, and the compiler your are using. I'm assuming you are building with GCC compiler for the A15F.
edit <Processor SDK>/ndk_2_25_01_11/ndk.mak
XDC_INSTALL_DIR = <Processor SDK>/xdctools_3_32_01_22_core
SYSBIOS_INSTALL_DIR = <Processor SDK>/bios_6_46_05_55
gnu.targets.arm.A15F = <CCS install>/ccsv7/tools/compiler/gcc-arm-none-eabi-4_9-2015q3
Edit ndk.bld and enable debug build. This is not strictly necessary, but makes life easier if you are stepping through the code in the debugger. Uncomment the following lines:
edit <Processor SDK>/ndk_2_25_01_11/ndk.bld
Pkg.attrs.profile = "debug";
gnuOpts += " -g ";
I find it easiest to create a Windows batch script to setup my build environment. Create the following file. This file must be in Windows file format (i.e. not Unix). The doskey command will create an alias for 'make' which will run the gmake.exe provided by XDCtools.
edit <Processor SDK>/ndk_2_25_01_11/dosrc.bat
@echo off
set system=C:\Windows\system32;C:\Windows;C:\Windows\System32\Wbem
set xdc=<Processor SDK>\xdctools_3_32_02_25_core
PATH=%system%
doskey alias=doskey /macros
doskey make="%xdc%\gmake.exe" $*
set system=
set xdc=
Now, open a DOS command window and navigate into your NDK folder. Run the batch script. Then clean the NDK product. You only need to clean once.
cd <Processor SDK>\ndk_2_25_01_11
dosrc
make -f ndk.mak clean
Build the NDK. The first build will take a few minutes. After that, to rebuild the NDK it will be much quicker.
make -f ndk.mak all
Now you will need to relink your application. As you add instrumentation to the NDK source files, just rebuild the NDK. It should be quick.
The NDK has a function called DbgPrintf(). The first argument is a level; just use DBG_INFO. The second argument is a printf standard format string. The remaining arguments correspond to the conversion specifiers in the format string.
For example, you could print the number of bytes received in NDK_recv(). Add the following statement near the end of the function.
edit <Processor SDK>/ndk_2_25_01_11/packages/ti/ndk/stack/fdt/socket.c
DbgPrintf(DBG_INFO, "NDK_recv: bytes=%d", error);
Note: the function always appends a newline character, so you should omit this.
The function is declared and defined in the following files.
<Processor SDK>/ndk_2_25_01_11/packages/ti/ndk/inc/os/osif.h
<Processor SDK>/ndk_2_25_01_11/packages/ti/ndk/os/ossys.c
In most cases, osif.h is included via stkmain.h, so you don't need to worry about this.
After you have added the DbgPrintf() calls, rebuild the NDK and relink your application. Load and run. To see the output, halt the processor and use ROV to open the SysMin OutputBuffer view. You should see your messages there.
You will probably want to increase the size of the SysMin buffer. This is done in the application config script.
var SysMin = xdc.useModule('xdc.runtime.SysMin');
SysMin.bufSize = 0x1000;
This is a circular buffer, it wraps when full. When this happens, you will only see the most recent output. Older output will have been overwritten.
I hope this will help us debug this issue.
~Ramsey
Ramsey,
“You probably already know this” – Take nothing for granted, I will not be insulted! But yes, I am calling in a loop.
Thanks for confirming the SO_RCVBUF and SO_SNDBUF. I was hoping that was the case since I’d rather not have to set all sockets the same as it would waste a lot of memory. Only a few will be receiving large streams.
Your understanding my situation re Windows vs EVM is correct. I’ve not seen any problems receiving the large data streams using my Windows application. As an aside, the Windows application is not part of my project deliverables but is just something I’ve put together for testing.
RE the comment about scheduling; I’ll keep that in mind. Would that explain wire the Wireshark captures show the EVM not replying with an ACK to larger transmissions for some reason?
I have a bunch of captures. I’m attaching one that shows the failure when sending 2064 bytes as show in my image and explained in the Apr 27, 2018 3:54 PM post. data_port_2048_evm.zip
I see you have another post and I’ll respond to that next.
Mike
Ramsey,
Your instructions for instrumenting the NDK source look good. Thank you for all the detail.
I took a stab this morning. I needed to install JRE but after that the clean went w/o error however I got the following error when trying to re-compile:
======== .libraries [./packages/ti/ndk/hal/eth_stub] ======== cla15fg package/package_ti.ndk.hal.eth_stub.c ... cc1.exe: fatal error: package/lib/lib/hal_eth_stub/package/package_ti.ndk.hal.eth_stub.d: No such file or directory compilation terminated. gmake[1]: *** [package/lib/lib/hal_eth_stub/package/package_ti.ndk.hal.eth_stub.oa15fg] Error 1 xdctools_3_32_02_25_core\gmake.exe: *** [packages/ti/ndk/hal/eth_stub,.libraries] Error 2 xdctools_3_32_02_25_core\gmake.exe: *** [all] Error 2
I searched all my ti source (PDK, NDK, etc and all versions. I do not have a ndk.hal.eth_stub.d file. I do have a
./ndk_2_25_01_11\packages\ti\ndk\hal\eth_stub\package\lib\lib\hal_eth_stub\package directory but it is empty. Do I need to install some additional source?
Mike
Mike,
My mistake. Sorry. I have a typo in the instructions above regarding the edits to ndk.bld. The option '-o0' should be omitted from the gnuOpts variable. Here are the correct edits:
edit <Processor SDK>/ndk_2_25_01_11/ndk.bld
Pkg.attrs.profile = "debug";
gnuOpts += " -g ";
I had been testing on a different platform because I don't have access to the EVM you are using. I'll edit the post above in case someone references it in the future.
~Ramsey
Ramsey,
Ok I made the correction and I am now able to recompile the NDK and link it with my arm application.
There must be something I need to set to get the DbgPrintf to go to the SysMin. I am not getting anything showing up. However I am now able to set break points in socket.c NDK_recv().
It is difficult to break on a non-error condition because I have lots of data coming in small streams successfully over other sockets. [also to elaborate a bit on the data streams; the stream implements a simple protocol where there is a header containing start a sequence, the number of bytes in the ‘message’, a message type, etc. So there is a receive state machine processing the incoming stream; read four bytes to confirm a ‘start of message sequence’, then read four bytes to get length, etc.]
I have set a breakpoint in NDK_recv() within if (error) {} (before return (SOCKET_ERROR)). When I send the large stream the break point gets hit but not until I see via Wireshark that the EVM server issues the [RST, ACK].
I can step into NDK_recv() where it calls
error = SockRecv(pfd, pbuf, (INT32)size, flags, 0, &rxsize);
that takes me to the file: ti\ndk\stack\fdt\sock\sock.c
I can single step through that function but I am unable to set any break points in it. Not sure why. I get a message “No code is associated with “fdt/sock.c”, line 1468”. Perhaps it would help if I could. When I hit the break point in NDK_recv(), the error is 54. I don’t see error getting set directly to 54 in SockRecv(). Maybe it comes from:
/* Return any pending error */ if( ps->ErrorPending ) { /* Don't eat the error if we're returning data */ if( !SizeCopy ) { error = ps->ErrorPending; /* Only consume the error when not peeking */ if( !(flags & MSG_PEEK) ) ps->ErrorPending = 0; } goto rx_dontblock; }
To sum up, I’ve got debug capability, DbgPrintf( ) is not filling SysMin buffers, I can’t realistically print rxsize from NDK_recv() so I’ve not yet learned much useful.
Can you suggest the next step?
Mike
Mike,
Let's work on fixing DbgPrintf(). With CCS attached to your client program, open ROV and select the System module. Select the Raw view. Expand the SupportProxy entry. Verify $name is set to xdc.runtime.SysMin.
Can you set a breakpoint in DbgPrintf() and verify it is calling System_vprintf(). Right after this call, you should see the output in ROV SysMin OutputBuffer view. Is this not happening?
The NDK or the application might be calling SysMin_flush(). If so, then the SysMin OutputBuffer would be drained and written to the CIO buffer. Try setting a breakpoint in this function. Ideally, you should not hit this breakpoint.
I hope this will shed some light on the DbgPrintf() problem.
I cannot find the following file in the Processor SDK:
ti\ndk\stack\fdt\sock\sock.c
I have ti/ndk/stack/sock/sock.c
Did you import another version of NDK into your project?
~Ramsey
Ramsey,
I sure appreciate your help here.
My application does use System_printf() and System_flush() in several places. The flush gets the data to the CCS console. I do not see the data form DbgPrintf() shopwing up on my console where as my System_printf() debug states do.
Using ROV, I verified $name is set to: xdc.runtime.SysMin
Stepping into DbgPrintf(), Level is set to 1 and so if( Level >= DBG_PRINT_LEVEL ) is false, thus nothing is printed. Looks like DBG_PRINT_LEVEL resolves to _oscfg.DbgPrintLevel which I see in the debugger is 2. So I guess I need to use something other than DBG_INFO in the DbgPrintf() or change the DBG_PRINT_LEVEL.
Sorry, I got my paths names messed up. The stack looks like this:
If I try to set a breakpoint in SockRecv() here is what I get:
The Warning weirdly has the path “fdt/sock.c” but you can see the complete file name at the top and it is clearly not in fdt/. At any rate, I cannot set a breakpoint.
Mike
Mike,
Your welcome. I'm sorry this is taking so long to resolve. Thanks for your patience.
Let me give you some details regarding System_flush(), because I think it is relevant to your setup. Many of our examples use System_flush() for "ease-of-use". As you noted, this causes the data in the SysMin OutputBuffer to be drained and written to the CCS Console view. However, this process is very intrusive to your system. To make this work, CCS sets a breakpoint on the CIO buffer. When the CIO buffer is full, CCS halts the target, reads the CIO buffer, and renders the data to the Console view. It then releases the target. On the target, the call to System_flush() transfers the data from the SysMin OutputBuffer to the CIO buffer. Unfortunately, the CIO buffer is quite small, so the target gets halted several times during the call to System_flush().
The behavior above is "nice" because you get to see data show up in the console view as the target is running. But it can cause your target to miss real-time because of all the processor halting. Considering that you are debugging a real-time network issue, I would recommend removing the calls to System_flush(). Let your target run until the failure has occurred, then halt and post-process the trace output. I know this is more difficult, but it will help avoid new failures introduced by the instrumentation.
Re: DbgPrintf(). Looks like you figured out why it wasn't working. I must have _oscfg.DbgPrintLevel set to 1. Using 1 might enable DbgPrintf() statements already in the code.
Re: breakpoint failure. I can't explain this. I'll have to investigate further and get back to you. But I would not let this stop you from making more progress.
Assuming you have DbgPrintf() working now, I suggest you add instrumentation as needed and use the post-process technique to continue your debug effort. This will let the system run in near real-time because the calls to DbgPrintf() are very low overhead (compared to CIO usage).
~Ramsey
Mike,
Our thinking here is that the TPC packets are being dropped on the client side. The NIMU driver will pass all packets to the function NIMUReceivePacket(). This is where the packet begins its climb up the NDK stack.
<Processor SDK>/ndk_2_25_01_11/packages/ti/ndk/stack/nimu/nimu.c
Add a DbgPrintf() in the check for a null packet.
if (ptr_pkt == NULL) {
DbgPrintf(DBG_INFO, "NIMUReceivePacket: NULL packet received");
return -1;
}
Further down the function is a switch statement. You might want to print the packet type right before the switch statement.
DbgPrintf(DBG_INFO, "NIMUReceivePacket: type=0x%x", Type);
switch ( Type )
{
...
}
Our assumption is that an IP packet has been received. It should invoke IPRxPacket().
<Processor SDK>/ndk_2_25_01_11/packages/ti/ndk/stack/ip/ipin.c
Add a DbgPrintf() in this function.
DbgPrintf(DBG_INFO, "IPRxPacket: _IPExecuting=%d", _IPExecuting);
If you don't see anything, then the packet is being dropped in the NIMU driver. Otherwise, it is probably being dropped somewhere in the NDK stack. Keep following the packet up the stack until we learn something useful.
If you have trouble finding a function, use the Disassembly window to set a breakpoint on the function. Then you can determine the source file.
BTW, the Disassembly window might also help when your are unable to set a breakpoint in the source window. This might mitigate the breakpoint trouble you are having.
Re: EVM connection. I'm assuming that both EVMs are connected to a switch. Is this not so? Do you really have them connected directly to each other with one crossover cable? If you are not using a switch, would you try adding a switch to see if it helps. The switch performs some data buffering which would not happen if both EVMs are connected directly to each other. I'm thinking that without this buffering, the EVMs are having trouble with larger buffer transfers.
Also, how did you make the Wireshark capture? We were assuming you are using a switch with port mirroring. Wireshark would be running on a PC and capturing data by mirroring one of the ports connected to an EVM. Would you provide some details on this.
~Ramsey
Ramsey,
I added the debug and did some testing this morning. Yes I think the drop is on the client side since the same server data makes it to my Windows test client when I use that in place of the EVM client.
With the added code I am getting lots and lots of data in SysMin because I have other sockets activity communicating. I can see other data packets coming in that I recognize based on read sizes but when I see on Wireshark the large packet go, I hit Suspend and see nothing that might indicate I received that large packet of data. I do see a slew of ARP packets (Type 0x806).
I modified my code slightly so that I could try and stop other socket comms from happening and now I have a new problem I need to figure out. I am getting a SWI, “ Unhandled ADP_Stopped exception” in a task called ConfigBoot. I’ve not seen this task before. A time of the crash it is in Preempted state, has priority 5 and stack size 4096. Fxn = NS_BootTask. I’ve got a call in the callback NetworkOpen() that I use to signal my other socket threads that the network is up and to start establishing connections to the other EVM servers. Those other tasks are running at a higher priority, 7. I’ve got my network stack at priority 8. Below is a screen shot of the ROV tasks at time of crash. Can you shed some light on ConfigBoot? May I need to raise its priority above the socket tasks'?
Re the connection. Yes I misspoke on the connection. I have tried two different approaches but I’ve not tried a direct connection but I will because your comment gives me some worry.
Approach #1 : To get the Wireshark captures I connect the 2 EVM and the Windows laptop with Wireshark and/or the Windows test client via a Linksys 8-port hub. (model EWHUB).
Approach #2: I use a Linksys WRT54G that acts as a 10/100 switch. With this I cannot snoop with Wireshark the comms between the two EVMs. I don’t know what ‘port mirroring’ is and I’m pretty sure I’m not doing it.
Mike
Mike,
The task NS_BootTask (ConfigBoot) is created by the task which calls NC_NetStart(). I think in your case, this would be the networkStack task. NS_BootTask should do its work and then self terminate. The Idle task will delete the task object, thus removing all traces. We discussed this a little on your other forum thread.
I see in your screen shot that NS_BootTask is in the preempted state. This means it did not get a chance to finish doing its work before another thread of higher priority became ready to run. Ideally, this task should finish and terminate before your application tasks start running. It could also be preempted due to the Swi which you mention above.
The very last thing that NS_BootTask does is to invoke the NetworkOpen() callback. You are using this callback, to release your socket threads, which are higher priority. This is probably why NS_BootTask is preempted. But I would expect your socket tasks to block at some point, which should allow NS_BootTask to finish and terminate. Maybe your screen shot was taken before this happens.
If NS_BootTask never terminates, this would imply your system never has any idle time. This is not good. There should always be some idle time, otherwise it indicates your systems is over committed.
Re: Unhandled ADP_Stopped exception. I'll have to investigate this. How is this manifesting itself? In the CCS Debug view? Does the ROV Hwi Exception view have any useful information?
I understand the difficulty of stopping the processor at just the right time. Here is a technique I use. Figure out a way to determine the failure point, then start a one-shot timer which will hit a break point in the near future.
For example, if you can identify the last good packet received before the expected failure packet (say with some special data signature), then start a one-shot timer to expire in 4 milliseconds. This should be enough time for the next packet to be received but not too much time to loose your trace data in the SysMin OutputBuffer. Set a CCS breakpoint in the one-shot timer function.
Here is an example of creating a one-shot timer.
#include <ti/sysbios/knl/Clock.h>
Clock_Params clock_p;
Clock_Handle DBG_oneshot = NULL;
Clock_Params_init(&clock_p);
clock_p.period = 0; /* one-shot timer */
clock_p.startFlag = FALSE; /* disable auto-run */
DBG_oneshot = Clock_create(DBG_oneShotFxn, 4, &clock_p, NULL);
Here is your one-shot timer function.
void DBG_oneShotFxn(UArg arg)
{
/* empty */
}
Use the following code to start the one-shot timer. This can be placed in another file.
#include <ti/sysbios/knl/Clock.h>
extern Clock_Handle DBG_oneshot;
Clock_start(DBG_oneshot);
Set a CCS breakpoint on DBG_oneShotFxn(). This allows you to run for a little before halting CCS. You might need to tune the one-shot delay and/or the size of the SysMin OutputBuffer to capture the interesting trace values.
Using this technique might be better than modifying your application to send less data. Changing the behavior of the application might alter the execution flow such that the bug stops manifesting itself.
Thanks for detailing your EVM connections. This helps us visualize your setup.
~Ramsey
Ramsey,
The screen shot was taken after the halt. Yes, my assumption as well was that my socket tasks preempted ConfigBoot and somehow the precipitated the crash. As I said, I made some subtle changes in the way the other tasks are started so I assume it is a timing issue that just reared its head and needs to be correctly fixed. Hence my question about raising ConfigBoot to a higher priority, like 8, so that my tasks do not preempt it. I really do not want to lower the other tasks nor do I want to put an arbitrary timer in as that seems a spotty solution.
Before the changes I made that cause this crash, ConfigBoot does terminate and goes away. I have never seen it before. I believe we are seeing the idle task run so I do not think we are close to over committed.
I have created a pair of arm applications that I hope will demonstrate the problem I am seeing with minimal complication. These are derived from NIMU_emacExample_EVMK2H_armBiosExampleProject. I changed that from UDP to TCP. And tried to keep them as lean as possible.
emacTcp_server uses the standard DaemonNew to spin off a server that once a client connects sends incrementally larger streams of data starting at 200 bytes and increasing by 200 each iteration. The first four bytes of the sent data contains the length of the data being sent.
emacTcp_client creates a receiver task from the NetworkOpen callback. That receiver task tries to receive the data until it gets a connection reset when it than closes the connection, closes the socket and starts over. In the function connect_() I set the TCP RX and TX buffer sizes and set KEEPALIVE, like I do in my actual application.
The server is at IP 192.168.1.201. The client at 192.168.1.200. The server is listening on port 15002.
I start the server and then disconnect CCS. I start the client and watch the CIO console output and Wireshare (running on the Windows computer and connected to the same hub). The problem manifests itself just as in my real application.
Thank you for the tips on debugging. I’ll keep those in mind. Hopefully we can focus on the above pair of shared applications. The Server can be setup to start off with a large packet and cause the failure immediately. (although I’ve not tried it yet – I’ll do that next – I wanted to get this out to you all asap).
Mike,
Many thanks for the client server example. This is a great help. We will investigate this and get back to you.
Thanks for clarifying the thread screen shot. Unfortunately, NS_BootTask is created using priority OS_TASKPRINORM. To raise its priority, you would probably have to configure OS_TASKPRINORM and OS_TASKPRIHIGH to the same value. I'm not sure how this would effect the NDK stack.
~Ramsey
No problem. I sure hope you see it demonstrate the issue. Please advise as soon as possible whether it does or does not. Not sure what it will tell me if you don't see it.
I'm really struggling with the entire network task priority issue. I have another E2E thread on the topic that I need to go back and revisit. Given that the literature on the keystone rtos discussed 15 levels of task priority, our design made use of 15 levels. As you are aware, our application is very much network processing driven and those network tasks need to be running at some of the highest priorities in our design but as it has become clear, there are limits that effectively cut the top of our design range from 15 to 7. I just mention this here as a bit of a rant. Please there is no need for us to discuss the topic here and further divert the focus of these thread. I'll try to find another work around for now.
Mike
Mike, Eric,
I ported the example to TM4C129x. It runs without error. I think this means the stack is okay and the issue must be lower. Maybe in the driver?
~Ramsey
Mike, Eric,
I was premature in declaring success on TM4C129x in my previous post. Although the example runs without error, my configuration does not match your example. I'm still working through the configuration details.
However, in reviewing the example with our network expert, we suspect a possible issue with the client call to recv(). In particular, the MSG_WAITALL option. We suspect this modifies the behavior of recv() to wait until the driver has received the requested payload size. This means the driver is storing the received data in the packet buffers, which are limited in size and number. When the driver runs out of packet buffer, subsequent Ethernet frames are simply dropped.
This could explain the observed behavior. Once the client driver starts dropping frames, it means the TCP layer will never acknowledge the receipt of the packet. The server will resend the TCP packet, but eventually it will give up and mark the failed packet as ETIMEDOUT. The next time the server calls send(), it will get back this error. This also causes the server to close the connection and the client receives an ECONNRESET error.
Mike, please remove the MSG_WAITALL option in your client's call to recv(). Just replace with zero. This should allow recv() to drain the driver packet buffers and allow the continued receipt of new data.
~Ramsey
Mike,
Thanks for trying out the MSG_WAITALL suggestion. My thinking was that on the second call to recv(), after having determined the payload size, that recv() would return with fewer bytes than requested. But you are correct, it seems unlikely the driver would not have sufficient packet buffers for a 1500 byte payload.
However, we have another suggestion. I was eventually able to make my setup fail in the same way that you and Eric are observing. It turns out there is a bug in the EMACSnow driver where it would incorrectly compute the payload size on a full Ethernet frame. It was not accounting for the checksum at the end of the buffer. My guess is that the same bug exists in the NIMU driver (which you are using on K2).
But, I'm able to make the example work again by reducing the server's TCP transmit buffer size to 1400 bytes. This will yield a 95% payload usage at the Ethernet frame but, hopefully, avoid this bug. Try adding the following to your server code.
uint value = 1400;
CfgAddEntry(hCfg, CFGTAG_IP, CFGITEM_IP_SOCKTCPTXBUF,
CFG_ADDMODE_UNIQUE, sizeof(uint), (UINT8 *)&value, 0);
Eric,
I'm attaching the bug fix for the EMACSnow driver for your inspection. Maybe you can identify a similar place in the NIMU driver where this fix could be applied.
Credit must be given to Chester Gillon for the fix.
~Ramsey
Ramsey,
I added the code to set CFGITEM_IP_SOCKTCPTXBUF to 1400 and indeed the transfers continue to operate so you and your team are on to the problem.
I am confused as to what CFGITEM_IP_SOCKTCPTXBUF actually does. The NDK API manual only says “TCP Transmit allocated buffer size”. It is a socket level setting. In another E2E question I believe it was confirmed that this becomes the default for sockets and can be changed per socket using setsockopt( clientS_, SOL_SOCKET, SO_SNDBUF, &option, len ); like I am doing in the client example. With the server daemons, those connected sockets have to use the default since once connected it is my understanding that it is too late to modify the socket properties with setsockopt().
In the test I just ran, the server code sent = send( s, data, remaining, 0 ); always returns with all bytes consumed/sent on the first call; i.e., sent == remaining. So some buffering is happening here and I thought that level of buffering was controlled by SO_SNDBUF/CFGITEM_IP_SOCKTCPTXBUF. I thought the returned value sent would never be greater than CFGITEM_IP_SOCKTCPTXBUF. What am I not understanding?
We did initial throughput testing here over six months ago by sending data from the EVM to a Windows application. The EVM being the server. By leaving the TXBUF at the default of 8192 I was only getting about 40Mbyte/sec though. By increasing the TX BUF to 25,000 I achieved around 115Mbytes/s. Here is a E2E thread where I was asking about throughput: http://e2e.ti.com/support/dsp/c6000_multi-core_dsps/f/639/p/626410/2310102#2310102
Without going back and revisiting the original testing, I think setting the TX BUF to 1400 will be a significant show stopping throughput hit for us. Even a 5% hit would be troublesome. We’ve wanted jumbo frame support from the driver to eak out a bit more throughput but have been told that it is not there and I don’t get the feeling that it will be added. The ‘client’ in our application is also a server to other non SBC computer clients. At the moment, none of those messages incoming from those client computers are over 1000 bytes but that could change and we don’t manage the code running on those (can’t tell them to set tx bufs to 1400).
I’m surprised no one has hit this bug before. In hind sight we should have also tested client receive because now I am concerned.
Going forward, what now are the plans to fix the identified driver bug? Setting tx buf to 1400 can’t be an option. And (being greedy?) can physical layer disconnect detection and jumbo frame support be added at this time?
Kind regards, Mike
Mike,
Glad to hear we are finally narrowing down on the root cause. Yes, of course, this bug must be fixed as the final solution. This work around would hopefully unblock you, so you may continue your application development. The next step is to have the NIMU driver team find and fix this bug.
As you know, CFGITEM_IP_SOCKTCPTXBUF defines the size of the socket transmit buffer. When your application calls send(), the data is copied from the application buffer into the socket transmit buffer. Then the network task takes over and copies the data from the transmit buffer into available packet buffers. Then the driver takes over and sends the data out the wire which will free up the packet buffers.
If the socket transmit buffer is large enough to hold the entire application payload, then the call to send() copies all the data into the transmit buffer in one go, and the task is free to return and do other work (as permitted by the RTOS scheduler). However, if the socket transmit buffer is small, the call to send() will fill the buffer, and then the task will block (not return). The network task runs and transfers the data to the packet buffer and passes control to the driver. At that point, the application task can run again and fill the transfer buffer again. This cycle repeats until the entire payload has been sent. Finally, the application task will return from send(). So, in both cases, there is only one call to send() but there will be different scheduling behavior between the tasks.
By making the socket transmit buffer slightly smaller than a full Ethernet frame, it prevents the network task from completely filling a packet buffer (there are a few unused bytes). This avoids the bug in the driver.
I'm not familiar enough with the code to explain when send() would return with fewer bytes sent then requested. It might depend on which driver is in play. For example, when all packet buffers are in use, maybe send() would return early instead of blocking.
As for performance, certainly the application task will spend a lot more time in send() if the transmit buffer is small because it must wait for most of the data to be actually transmitted to the far end. This delay would be dependent on network congestion and time taken by the far end to actually receive the data.
I'm hopeful the driver bug will be addresses in a timely fashion. Getting new features implemented usually takes longer, but you never know. I expect someone from the driver team will take over.
~Ramsey