Other Parts Discussed in Thread: ADS1293
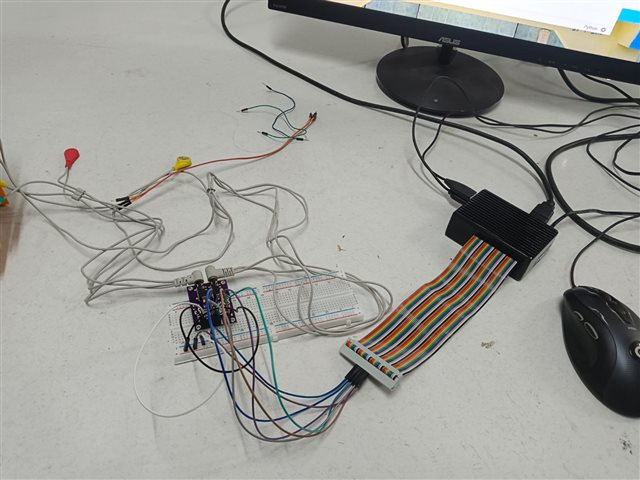
hello, I am a newbie in ECG research. I'm working on Research on ECG signal using ADS1293 dn raspberry pi 4, python oemogram. However, I faced a problem, namely when the SPI program was run it turned out that there was no output in the form of voltage values in lead 1 and lead 2 and there was no graphic data on the plotter. Can anyone help me provide a solution? when I first tried to connect ads1293 to the raspberry and run the program, the voltage value was still reading and the graph didn't appear.