This thread has been locked.

If you have a related question, please click the "Ask a related question" button in the top right corner. The newly created question will be automatically linked to this question.

TCAN1044A-Q1: Rise time/Fall time max limits

Part Number: TCAN1044A-Q1

Hi,

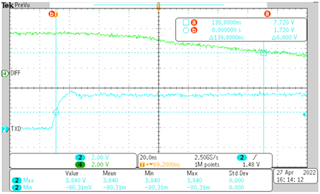
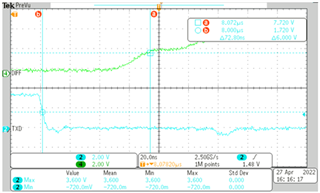
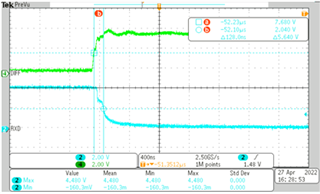
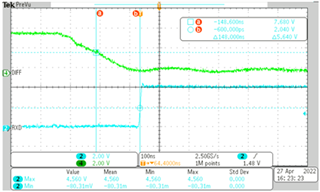
During bench testing (@25C), it was observed that the for 250kbps baud rate, the rise time and fall time of CANH & CANL are followings:

CANH: rise =51.6ns , fall = 124ns

CANL rise = 100ns and fall 49.6 ns

Vdiff rise = 62ns and fall 314 ns

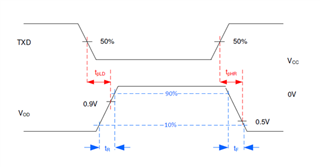
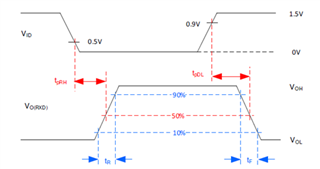
In the datasheet, these values are mentioned for the condition (STB = 0V or Short to ground) RL = 60ohm, CL = 100pF)

Please let me know what should be the rise/fall time fall time values for normal operation in order to have pass fail criteria.

Test set up details:

Used PCAN tool in laptop for communication. wire length (~1.5m)

Probes: Used differential probe or spring probe.

Please let me know if you have any question.

Thanks,

Sunney

  • Hi Sunney,

    The rise and fall time specifications were characterised by measuring the time it takes for the differential voltage to transition from 10% to 90% of its final dominant value. This was done on a simulated differential bus load of 60-ohms and 100pF. No cabling, secondary transceivers, or other external loads were applied to the circuit. We do not specify individual signal rise/fall time (CANH alone or CANL alone), only that of the differential signal. 

    Because the setup you describe includes a separate PCAN tool and cable, I would expect the measured values to be different from the typical values in the datasheet. This is especially true if the bus capacitance (single ended and differential) is significant as this has a large impact on particularly the dominant-to-recessive transition time. 

    The more critical value typically evaluated in a CAN system is the propagation delay or loop time of a transceiver. This measurement describes the practical signal delay introduced by the transceiver accounting for both the driver and receiver delay. Have you had a chance to measure this behavior in your system to see if there appears to be significant difference from datasheet specifications? If there is a particular system concern regarding the differential signal transition times that is not addressed by the propagation delays, please let me know and we can address it more directly. 

    Regards,
    Eric Schott

  • Hi Eric,

    Thanks for the response.

    We have tested the propagation delay of Vdiff signal w.r.t. to TXD and RXD and those values also differ from the datasheet values, pls refer below waveforms and test data.

    Loop delay is not tested yet TXD and  RXD i.e. tLOOP1 and tLOOP2.

    As you have mentioned, no cabling ,secondary transceivers or external loads were used for datasheet values, the below results lies in same category as in my initial post. 

    Although loop delay values should match with the one present in datasheets. Is this understanding correct? 

    Driver characteristics

    Datasheet values

    Tested values

    tpHR

    80ns

    139.8ns

    tpLD

    70ns

    72.8ns

    Receiver characteristics

    Datasheet values

    Tested values

    tpRH

    81ns

    148ns

    tpDL

    66ns

    128ns


    Regards,

    Sunney

  • Hi Sunney,

    For the driver characteristics, it seems only the measured dominant-to-recessive (tpHR) time is larger than expected. This transition is not actively driven by the transceiver and is mainly a characteristic of the network, namely the differential capacitance discharging through the termination resistance. Are the load conditions for this test the same as the datasheet values? Without the 60-ohms of termination between CANH and CANL, I would expect this transition to be slow as there is no external discharge path between these signals. 

    For the receiver characteristics, it appears the measurements were taken in reference to when the Vod reached 50% of its final value. The datasheet characterises this time from when Vod reaches the defined CAN recessive (0.5V) or dominant (0.9V) thresholds, so this may be a source of discrepancy between the values. The bus load mentioned previously will also impact these measurements as different load conditions will mean the slew rate of the Vod transition is different. 

    Also, I'll mention that the loop delay times are not necessarily tpHR + tpRH or tpLD + tpDL. Because the thresholds of the receiver are different from the measurement thresholds, this combined loop time will be shorter when measured directly. 

    As we do not specify maximum values for these characteristics on the datasheet, it is difficult to point to these measurements as a discrepancy for the device. Is there a specific concern that the customer has regarding this behavior and how it impacts their system? Or are these parameters required for a different part of their specification? If their main concern is to verify datasheet values with unit performance, I would encourage the customer to measure the loop delays as these are better defined in the datasheet and more applicable to system behavior. 

    Regards,
    Eric Schott