This thread has been locked.

If you have a related question, please click the "Ask a related question" button in the top right corner. The newly created question will be automatically linked to this question.

HD3SS3212: S-parameter model weird waveform and Tjmax spec check

Part Number: HD3SS3212
Other Parts Discussed in Thread: HD3SS3412

Hello expert,

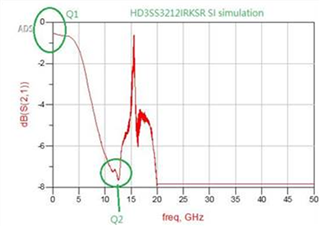
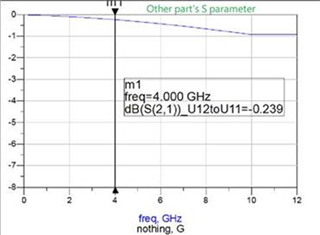
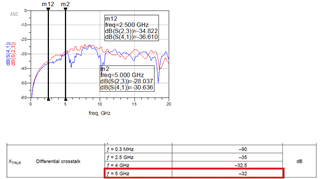
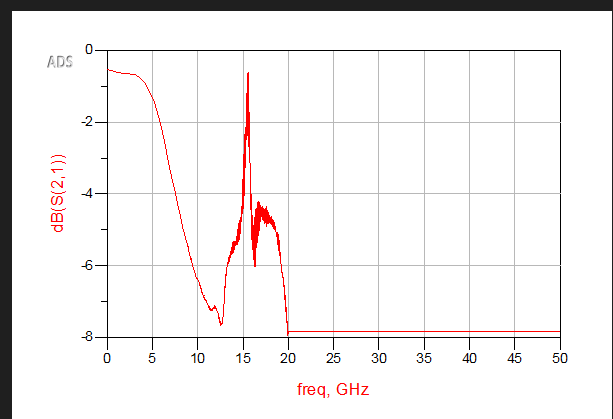
May we know if you can check below waveform that customer used HD3SS3212 S-parameter to simulate their application? It seems like the result is not correct but customer don't know how to debug it. Is there anything we need to provide to you for this debug? 

For the Tjmax, I checked that Brian has replied that HD3SS3212 Tjmax should be 105C. Is that correct?

https://e2e.ti.com/support/interface-group/interface/f/interface-forum/755296/hd3ss3212-hd3ss3212irkst-component-junction-temperature-spec-tjmax?tisearch=e2e-sitesearch&keymatch=tjmax%20hd3ss3212#

Best regards,

Ann Lien

  • Hi Ann,

    I'm working on this, will have an answer today or tomorrow

    Best,

    Shane

  • Hi Ann,

    The HD3SS3212 has a maximum data rate of 10Gbps which happens at 5Ghz. The behavior above this frequency should not matter and the behavior below seems normal. Is there a reason your waveform goes higher?

    Best,

    Shane

  • Hello Shane,

    Got it and we don't need to take care of the behavior higher than 5GHz. Will let customer know it, thanks!

    Best regards,

    Ann Lien

  • Hi Shane

    customer side still have those question:

    Q1. The loss @0Hz is near 1dB, it’s larger than our expectation which usually is close to 0dB. Please check if your S-parameter is correct.

    Q2. We require to know your part’s behavior up to 12GHz (i.e. 3 times of PCIe3 Nyquist freq) for eye-diagram simulation.

              However, your S-parameter curve up to 12GHz is weird to us, loss is high, and behaves too far away from a linear curve. We attach a normal part’s curve FYR.

    Please check if your S-parameter is correct.

    Q3. Is a S parameter model integrated with more ports available? At least .s8p or with ports higher than 8 is our minimum requirement for TX/RX crosstalk simulation

    BRs

    Brian

  • Hi Brian,

    Q1: The device has some DC loss so it may not start at precisely 0dB. When we run the S-parameter we see about 1/2 DB loss at 0Hz.

    Q2/Q3: After checking with the validation team, they noted that this file looks unusual. The team is taking new data for this device that seems more in line with what you would expect. It will be a .s12p file format so it should satisfy your need for more ports. I can send it to you as soon as it becomes available.

    Best,

    Shane

  • https://e2e.ti.com/cfs-file/__key/communityserver-discussions-components-files/138/HD3SS3212_2D00_SEL_2D00_A_2D00_to_2D00_B_2D00_s12p_2D00_file.s12p

    SEL pin=A>B
    10Mhz to 20GHz in 800 steps
    IF BW = 1kHz
    sweep pow = -15dBm
    
    port order:
    HD3SS3212 pin name	s12p file port#
    A0p			1
    A0n			2
    B0p			3
    B0n			4
    A1p			5
    A1n			6
    C0p			7
    C0n			8
    B1p			9
    B1n			10
    C1p			11
    C1n			12
    

    Hi Brian,

    I've attached the .s12p file. To answer the original question, 105C is the correct Tj max 

    Best,

    Shane

  • Hi Shane

    do you also have HD3SS3412 s12p or s8p file?

    BRs

    Brian

  • Hi Brian,

    Unfortunately, we do not have a s12p or s8p file for the 3412.

    Best,

    Shane

  • Hi Shane

    thanks for your help Slight smile

    do BU side have plan to build s12p or s8p file for the 3412?

    second question

    Our customer use s parameter file and have gap in 5GHz. have -4dB difference.

    If  S model comes from real measurement, would it more make sense to provide it which has been shown in the datasheet?

    BRs

    Brian

  • Hi Brian,

    1. Currently we do not have plans for an s12p file for the 3412.

    2. The datasheet model and the s-parameter model use data from different sources. In the datasheet, we use the average performance across many devices to fill the plot. In the S-parameter model only one device is used for capturing data, so the plot will reflect only that device. You may see differences in the plots because of this.

    Best,

    Shane