Other Parts Discussed in Thread: DP83867E, , DP83869EVM
Tool/software:
Hello dear TI Team,
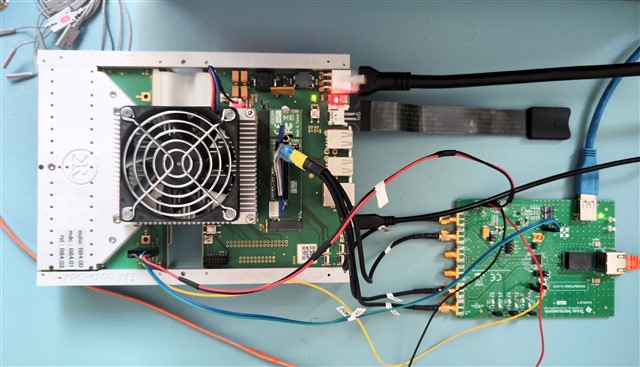
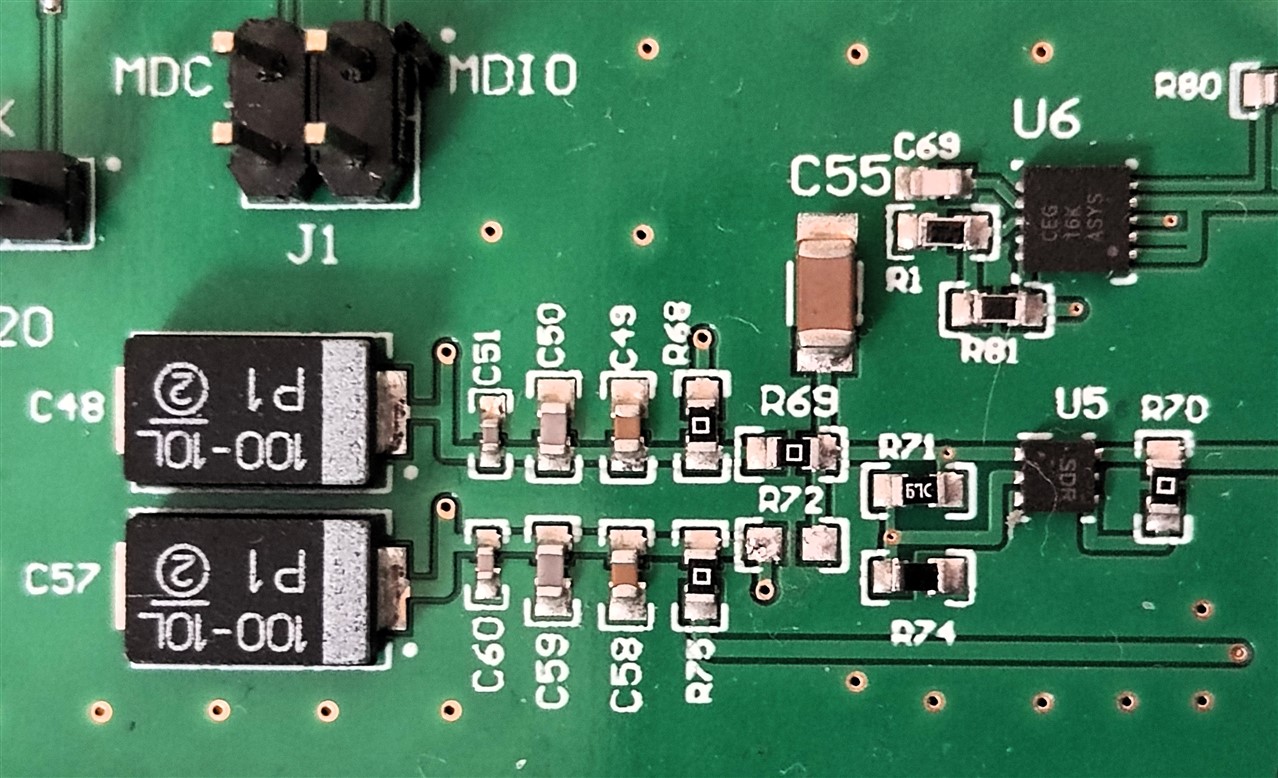
In our company, I am developing a network interface for the RFSoC ZU27DR based on the PHY DP83867E, that is using SGMII interface. I am using the original evaluation board from TI DP83867ERGZ-S-EVM, where I removed the R72 Resistor to apply VDDIO_EXT 3v3 from external power supply (about 35-38mA consume @ 3v3)
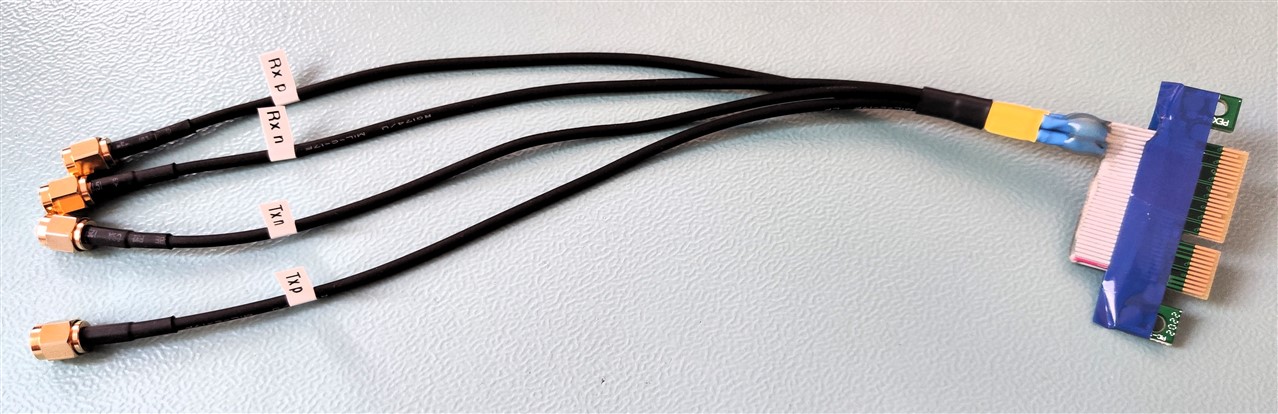
The FPGA is a module from KR (Knowledge Resources) with a KRC4700 carrier board. This carrier has no GT connectors (SMA or similar) and all PS-GTR are pined over a M.2 connector. I used and adapter M.2 to PCIe x4 to get access to the GT Lane 3, because the RefClk3 is the only one I can get access from a Si5332C clock generator.
Well I configured a Petalinux Project 2023.2 for this FPGA with the following device-tree:
The registers of the DP83867 seem to be ok, in the U-BOOT,
ZynqMP> mii read 0x00 0x00-0x1F
addr=00 reg=00 data=1140
addr=00 reg=01 data=796D
addr=00 reg=02 data=2000
addr=00 reg=03 data=A231
addr=00 reg=04 data=01E1
addr=00 reg=05 data=CDE1
addr=00 reg=06 data=006F
addr=00 reg=07 data=2001
addr=00 reg=08 data=4006
addr=00 reg=09 data=0300
addr=00 reg=0a data=3C00
addr=00 reg=0b data=0000
addr=00 reg=0c data=0000
addr=00 reg=0d data=401F
addr=00 reg=0e data=0000
addr=00 reg=0f data=3000
addr=00 reg=10 data=5840
addr=00 reg=11 data=BF02
addr=00 reg=12 data=0000
addr=00 reg=13 data=1C42
addr=00 reg=14 data=29C7
addr=00 reg=15 data=0000
addr=00 reg=16 data=0000
addr=00 reg=17 data=0040
addr=00 reg=18 data=6150
addr=00 reg=19 data=4440
addr=00 reg=1a data=0002
addr=00 reg=1b data=0000
addr=00 reg=1c data=0000
addr=00 reg=1d data=0000
addr=00 reg=1e data=0002
addr=00 reg=1f data=0000
ZynqMP> mii write 0x00 0x0D 0x001F
ZynqMP> mii write 0x00 0x0E 0x0031
ZynqMP> mii write 0x00 0x0D 0x401F
ZynqMP> mii read 0x00 0x0E
1031
ZynqMP> mii write 0x00 0x0D 0x001F
ZynqMP> mii write 0x00 0x0E 0x0032
ZynqMP> mii write 0x00 0x0D 0x401F
ZynqMP> mii read 0x00 0x0E
0000
ZynqMP> mii write 0x00 0x0D 0x001F
ZynqMP> mii write 0x00 0x0E 0x0033
ZynqMP> mii write 0x00 0x0D 0x401F
ZynqMP> mii read 0x00 0x0E
0000
ZynqMP> mii write 0x00 0x0D 0x001F
ZynqMP> mii write 0x00 0x0E 0x0037
ZynqMP> mii write 0x00 0x0D 0x401F
ZynqMP> mii read 0x00 0x0E
0000
ZynqMP> mii write 0x00 0x0D 0x001F
ZynqMP> mii write 0x00 0x0E 0x006E
ZynqMP> mii write 0x00 0x0D 0x401F
ZynqMP> mii read 0x00 0x0E
8820
ZynqMP> mii write 0x00 0x0D 0x001F
ZynqMP> mii write 0x00 0x0E 0x006F
ZynqMP> mii write 0x00 0x0D 0x401F
ZynqMP> mii read 0x00 0x0E
0110
ZynqMP> mii write 0x00 0x0D 0x001F
ZynqMP> mii write 0x00 0x0E 0x00D3
ZynqMP> mii write 0x00 0x0D 0x401F
ZynqMP> mii read 0x00 0x0E
0000
ZynqMP> mii write 0x00 0x0D 0x001F
ZynqMP> mii write 0x00 0x0E 0x0135
ZynqMP> mii write 0x00 0x0D 0x401F
ZynqMP> mii read 0x00 0x0E
0000
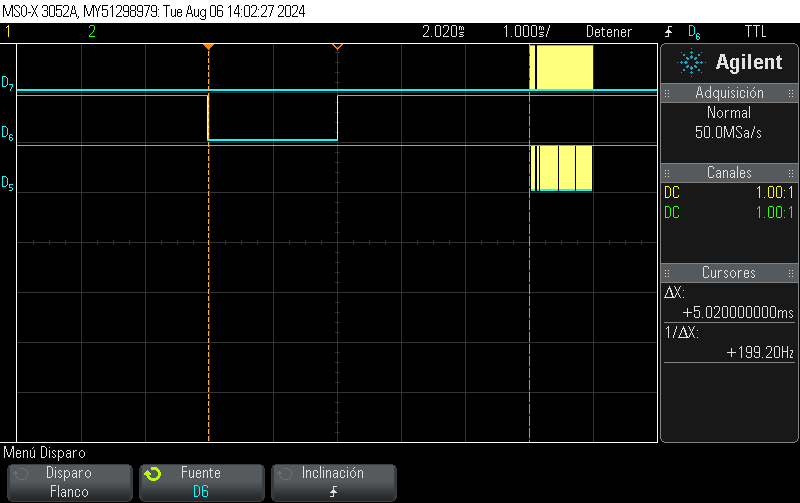
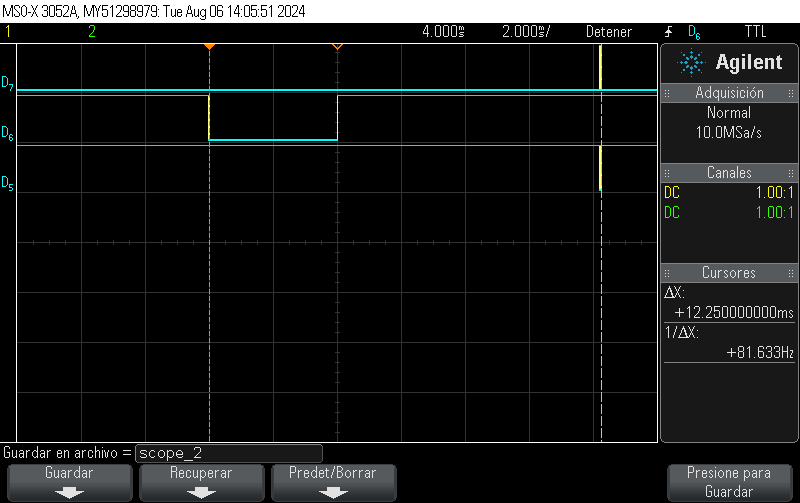
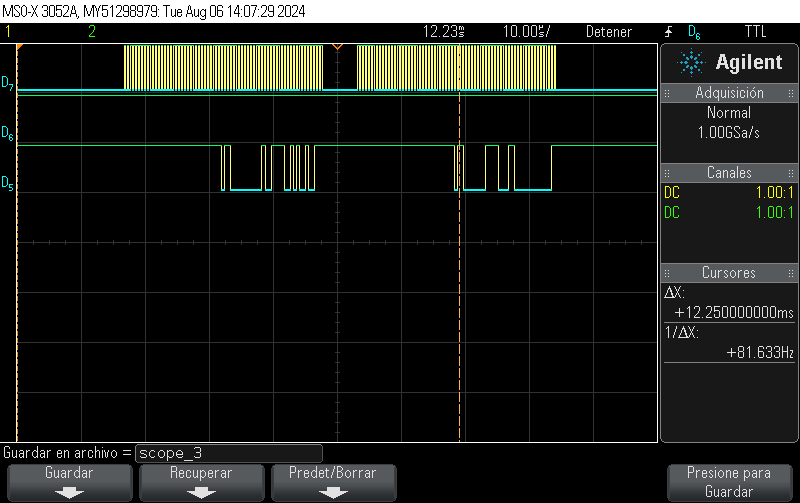
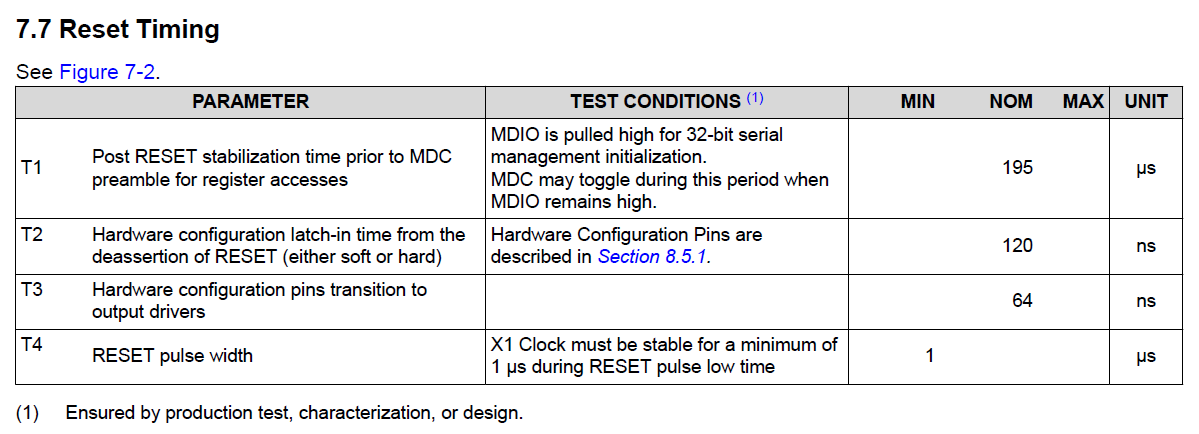
The reset is performed through an EMIO pin (pin EMIO0, or GPIO 78) and I observed it ocurrs once while FSBL and again after loading the kernel. The second reset (kernel) lasts double time than the first one (FSBL).
I fixed the ipaddr in the u-boot environment to try to ping from U-BOOT, but without success.
The GEM_CLK_CTL 0x00FF180308 register in the U-Boot shows the active mode for SGMII, but the GEM_CTRL 0x00FF180360 register indicates activity in GEM1, not GEM3 ????
ZynqMP> md 0x00FF180308 0x01
ff180308: 00030180 ....
ZynqMP> md 0x00FF180360 0x01
ff180360: 00000040 @...
After loading the Petalinux, the status from PHY registers is a bit different:
Reg: 0x00 Value: 0x1140
Reg: 0x01 Value: 0x796D
Reg: 0x02 Value: 0x2000
Reg: 0x03 Value: 0xA231
Reg: 0x04 Value: 0x09E1
Reg: 0x05 Value: 0xCDE1
Reg: 0x06 Value: 0x006F
Reg: 0x07 Value: 0x2001
Reg: 0x08 Value: 0x4006
Reg: 0x09 Value: 0x0300
Reg: 0x0A Value: 0x3C00
Reg: 0x0D Value: 0x401F
Reg: 0x0E Value: 0x1111
Reg: 0x0F Value: 0x3000
Reg: 0x10 Value: 0x5848
Reg: 0x11 Value: 0xAF02
Reg: 0x12 Value: 0x0000
Reg: 0x13 Value: 0x1C02
Reg: 0x14 Value: 0x2BC7
Reg: 0x15 Value: 0x0000
Reg: 0x16 Value: 0x0000
Reg: 0x17 Value: 0x0040
Reg: 0x18 Value: 0x6150
Reg: 0x19 Value: 0x4440
Reg: 0x1A Value: 0x0002
Reg: 0x1E Value: 0x0202
Reg: 0x1F Value: 0x0000
Reg: 0x31 Value: 0x1111
Reg: 0x32 Value: 0x00D3
Reg: 0x33 Value: 0x0000
Reg: 0x37 Value: 0x0000
Reg: 0x43 Value: 0x07A0
Reg: 0x6E Value: 0x8820
Reg: 0x6F Value: 0x0110
Reg: 0x86 Value: 0x0057
Reg: 0xC6 Value: 0x0000
Reg: 0xD3 Value: 0x0000
Reg: 0xFE Value: 0xE721
Reg: 0x134 Value: 0x1000
Reg: 0x135 Value: 0x0000
Reg: 0x16F Value: 0x0015
Reg: 0x170 Value: 0x0C12
Reg: 0x172 Value: 0x0000
Reg: 0x1D5 Value: 0xF500
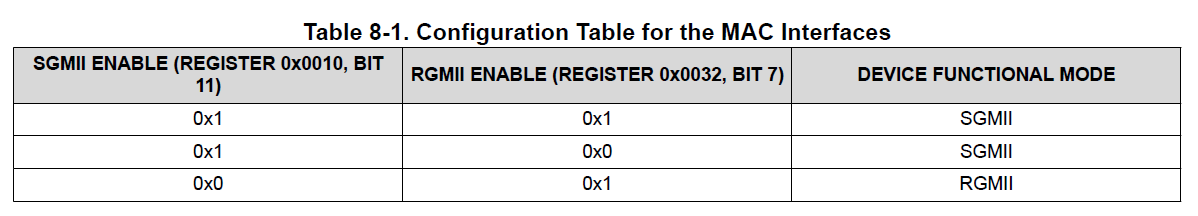
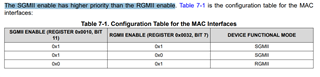
Now are both modes SGMII (Reg: 0x10/Value: 0x5848) and RGMII (Reg: 0x32/Value: 0x00D3) enabled but no Next-Page Autonegotiation as received (Reg: 0x11/Value: 0xAF02).
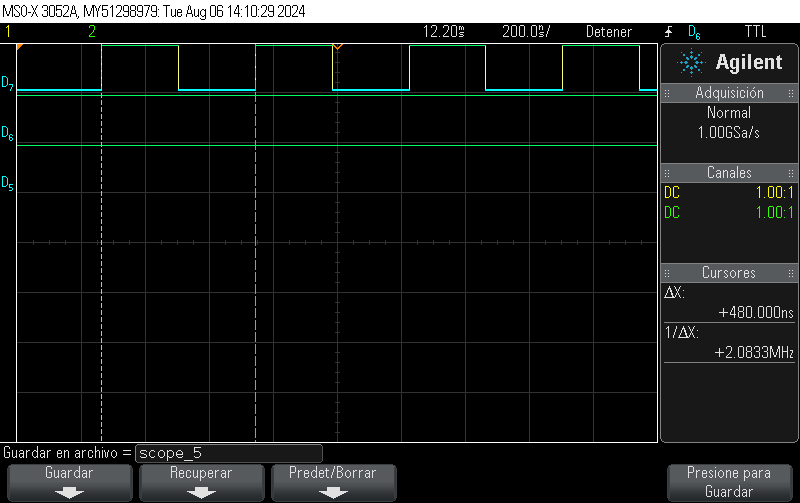
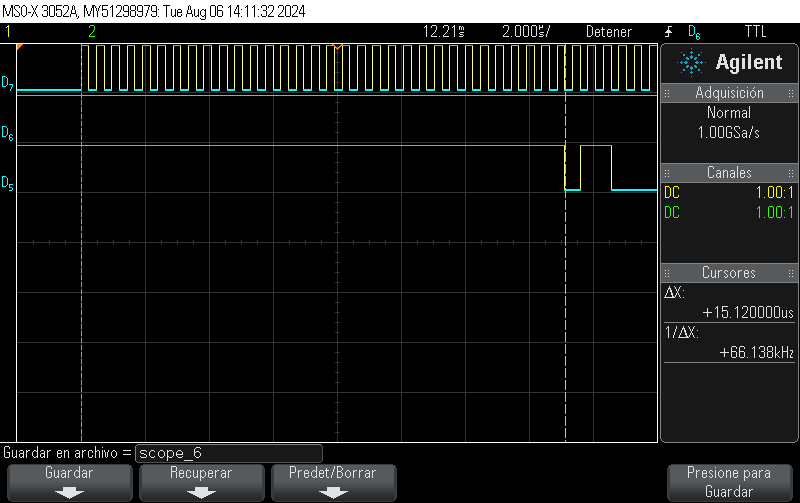
Regarding the strapping, I observed that depends on reset time: for short (< 300µs) resets, bootstrapping is a bit random. PHY address is sometimes 0x4, other 0x8 or even 0xC. This is due to the presence of signal in SO pins, while strapping. Pins are in mode 0 (floating) in the evaluation board, so only the 2 LSB from PHY address are right. Just extending the reset time (about 2000µs) is the problem corrected.
The link is up and no problem reported by macb,
[ 2.129416] macb ff0e0000.ethernet: Not enabling partial store and forward
[ 2.149860] macb ff0e0000.ethernet eth0: Cadence GEM rev 0x50070106 at 0xff0e0000 irq 45 (00:0a:35:00:22:03)
[ 7.627405] macb ff0e0000.ethernet eth0: PHY [ff0e0000.ethernet-ffffffff:00] driver [TI DP83867] (irq=POLL)
[ 7.637161] macb ff0e0000.ethernet eth0: configuring for phy/sgmii link mode
[ 7.650759] macb ff0e0000.ethernet: gem-ptp-timer ptp clock registered.
[ 11.743339] macb ff0e0000.ethernet eth0: Link is Up - 1Gbps/Full - flow control tx
[ 11.751079] IPv6: ADDRCONF(NETDEV_CHANGE): eth0: link becomes ready
Even I have IPv6, but impossible to obtain IPv4 (traffic?), even when connected to a DHCP server, nothing.
When I take a look to the network interfaces with ifconfig ...
eth0: flags=4163<UP,BROADCAST,RUNNING,MULTICAST> mtu 1500
inet6 fe80::20a:35ff:fe00:2203 prefixlen 64 scopeid 0x20<link>
ether 00:0a:35:00:22:03 txqueuelen 1000 (Ethernet)
RX packets 0 bytes 0 (0.0 B)
RX errors 0 dropped 0 overruns 0 frame 0
TX packets 77 bytes 22051 (21.5 KiB)
TX errors 0 dropped 0 overruns 0 carrier 0 collisions 0
device interrupt 45
lo: flags=73<UP,LOOPBACK,RUNNING> mtu 65536
inet 127.0.0.1 netmask 255.0.0.0
inet6 ::1 prefixlen 128 scopeid 0x10<host>
loop txqueuelen 1000 (Local Loopback)
RX packets 0 bytes 0 (0.0 B)
RX errors 0 dropped 0 overruns 0 frame 0
TX packets 0 bytes 0 (0.0 B)
TX errors 0 dropped 0 overruns 0 carrier 0 collisions 0
And the status of the eth0 with ethtools ...
root@sgmii:~# ethtool eth0
Settings for eth0:
Supported ports: [ TP MII ]
Supported link modes: 10baseT/Half 10baseT/Full
100baseT/Half 100baseT/Full
1000baseT/Half 1000baseT/Full
Supported pause frame use: Transmit-only
Supports auto-negotiation: Yes
Supported FEC modes: Not reported
Advertised link modes: 10baseT/Half 10baseT/Full
100baseT/Half 100baseT/Full
1000baseT/Half 1000baseT/Full
Advertised pause frame use: Transmit-only
Advertised auto-negotiation: Yes
Advertised FEC modes: Not reported
Link partner advertised link modes: 10baseT/Half 10baseT/Full
100baseT/Half 100baseT/Full
1000baseT/Half 1000baseT/Full
Link partner advertised pause frame use: Symmetric Receive-only
Link partner advertised auto-negotiation: Yes
Link partner advertised FEC modes: Not reported
Speed: 1000Mb/s
Duplex: Full
Auto-negotiation: on
master-slave cfg: preferred slave
master-slave status: slave
Port: Twisted Pair
PHYAD: 0
Transceiver: external
MDI-X: Unknown
Supports Wake-on: a
Wake-on: d
Link detected: yes
root@sgmii:~# ethtool -S eth0
NIC statistics:
tx_octets: 50685
tx_frames: 198
tx_broadcast_frames: 175
tx_multicast_frames: 23
tx_pause_frames: 0
tx_64_byte_frames: 38
tx_65_127_byte_frames: 21
tx_128_255_byte_frames: 0
tx_256_511_byte_frames: 139
tx_512_1023_byte_frames: 0
tx_1024_1518_byte_frames: 0
tx_greater_than_1518_byte_frames: 0
tx_underrun: 0
tx_single_collision_frames: 0
tx_multiple_collision_frames: 0
tx_excessive_collisions: 0
tx_late_collisions: 0
tx_deferred_frames: 0
tx_carrier_sense_errors: 0
rx_octets: 0
rx_frames: 0
rx_broadcast_frames: 0
rx_multicast_frames: 0
rx_pause_frames: 0
rx_64_byte_frames: 0
rx_65_127_byte_frames: 0
rx_128_255_byte_frames: 0
rx_256_511_byte_frames: 0
rx_512_1023_byte_frames: 0
rx_1024_1518_byte_frames: 0
rx_greater_than_1518_byte_frames: 0
rx_undersized_frames: 0
rx_oversize_frames: 0
rx_jabbers: 0
rx_frame_check_sequence_errors: 0
rx_length_field_frame_errors: 0
rx_symbol_errors: 0
rx_alignment_errors: 0
rx_resource_errors: 0
rx_overruns: 0
rx_ip_header_checksum_errors: 0
rx_tcp_checksum_errors: 0
rx_udp_checksum_errors: 0
q0_rx_packets: 0
q0_rx_bytes: 0
q0_rx_dropped: 0
q0_tx_packets: 154
q0_tx_bytes: 47664
q0_tx_dropped: 0
q1_rx_packets: 0
q1_rx_bytes: 0
q1_rx_dropped: 0
q1_tx_packets: 44
q1_tx_bytes: 2905
q1_tx_dropped: 0
The GEM_CLK_CTRL is a bit different after loading the Petalinux, ...
GEM_CLK_CTRL (IOU_SLCR) 0XFF180308 : 0x00020180
It seems to be not associated, the PHY GT with the GEM3.
I would be very gratefull if you could help me with this issue.