This thread has been locked.

If you have a related question, please click the "Ask a related question" button in the top right corner. The newly created question will be automatically linked to this question.

DP83TC812R-Q1: HELP TO CHECK DP83TC812 PHY REGISTER DATA

Part Number: DP83TC812R-Q1
Other Parts Discussed in Thread: TPD1E10B06-Q1, AM2732

Tool/software:

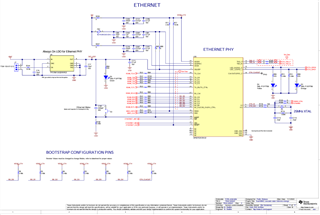
你好,我们使用TIDA020047开发板,需要使用83TC812芯片进行网络数据传输,但是我们配置了该芯片的寄存器后,却无法得到其输出的RGMII接口数据,通过示波器看了没有波形,不知道是否寄存器配置不正确,请帮我们核对一下:

REGADDR| DATA

0h | 0x2100| 1h | 0x0065| 2h | 0x2000| 3h | 0xA271| 10h | 0x2005| 11h | 0x010B| 12h | 0xE400| 13h | 0x0000| 15h | 0x0002| 16h | 0x0100| 18h | 0x5200| 19h | 0x0C0A| 1Bh | 0x0000| 1Eh | 0x0000| 1Fh | 0x0000| 41h | 0x88F7| 133h | 0x75EF| 17Fh | 0x4028| 180h | 0x0000| 181h | 0x0000| 182h | 0x0000| 183h | 0x0000| 184h | 0x0203| 185h | 0x000A| 187h | 0x0100| 188h | 0x0080| 189h | 0x0040| 18Ah | 0x0040| 18Bh | 0x1C0B| 18Ch | 0x0000| 18Eh | 0x8004| 300h | 0x2710| 301h | 0x1703| 302h | 0x0045| 303h | 0x0419| 304h | 0x0030| 305h | 0x0004| 306h | 0x000A| 310h | 0x0000| 430h | 0x0770| 444h | 0x0000| 450h | 0x2610| 451h | 0x0008| 452h | 0x0000| 453h | 0x0001| 456h | 0x0000| 457h | 0xE581| 458h | 0x0001| 45Dh | 0x028C| 45Fh | 0x000C| 485h | 0x1078| 486h | 0x0A05| 489h | 0x0001| 496h | 0x044C| 497h | 0x01C0| 4A0h | 0x1000| 553h | 0x0000| 560h | 0x07E4| 561h | 0x0801| 562h | 0x8028| 600h | 0x0038| 601h | 0x0000| 602h | 0x0000| 603h | 0x0000| 608h | 0x007B| 609h | 0x0000| 60Ah | 0x0200| 60Bh | 0x0005| 60Ch | 0x0024| 60Dh | 0x0000| 618h | 0x0000| 619h | 0x0574| 61Ah | 0x05DC| 61Bh | 0x007D| 61Ch | 0x0000| 61Dh | 0x0000| 61Eh | 0x0000| 620h | 0x0000| 622h | 0x0000| 623h | 0x0000| 624h | 0x5511| 625h | 0x0000| 626h | 0x0000| 627h | 0x0000| 628h | 0x0000| 629h | 0x0000| 62Ah | 0x0000| 639h | 0x0001| 63Ah | 0x0000| 63Bh | 0x0000| 63Ch | 0x0002| 63Dh | 0x0000| 63Eh | 0x0000| 648h | 0x0120| 649h | 0x0001| 64Ah | 0x0010| 871h | 0x00EE| 1000h | 0x0000| 1001h | 0x0004| 1007h | 0x003D| 100Bh | 0x0800| 1012h | 0x0001| 1834h | 0xC000| 1836h | 0x0000| 3000h | 0x0000| 3001h | 0x0004|

  • Hello, we use the TIDA020047 development board and need to use the 83TC812 chip for network data transmission. However, after we configure the registers of the chip, we cannot get the output RGMII interface data. We see that there is no waveform through the oscilloscope. I don't know if the register configuration is incorrect, please help us check it:

    REGADDR| DATA

    0h | 0x2100| 1h | 0x0065| 2h | 0x2000| 3h | 0xA271| 10h | 0x2005| 11h | 0x010B| 12h | 0xE400| 13h | 0x0000| 15h | 0x0002| 16h | 0x0100| 18h | 0x5200| 19h | 0x0C0A| 1Bh | 0x0000| 1Eh | 0x0000| 1Fh | 0x0000| 41h | 0x88F7| 133h | 0x75EF| 17Fh | 0x4028| 180h | 0x0000| 181h | 0x0000| 182h | 0x0000| 183h | 0x0000| 184h | 0x0203| 185h | 0x000A| 187h | 0x0100| 188h | 0x0080| 189h | 0x0040| 18Ah | 0x0040| 18Bh | 0x1C0B| 18Ch | 0x0000| 18Eh | 0x8004| 300h | 0x2710| 301h | 0x1703| 302h | 0x0045| 303h | 0x0419| 304h | 0x0030| 305h | 0x0004| 306h | 0x000A| 310h | 0x0000| 430h | 0x0770| 444h | 0x0000| 450h | 0x2610| 451h | 0x0008| 452h | 0x0000| 453h | 0x0001| 456h | 0x0000| 457h | 0xE581| 458h | 0x0001| 45Dh | 0x028C| 45Fh | 0x000C| 485h | 0x1078| 486h | 0x0A05| 489h | 0x0001| 496h | 0x044C| 497h | 0x01C0| 4A0h | 0x1000| 553h | 0x0000| 560h | 0x07E4| 561h | 0x0801| 562h | 0x8028| 600h | 0x0038| 601h | 0x0000| 602h | 0x0000| 603h | 0x0000| 608h | 0x007B| 609h | 0x0000| 60Ah | 0x0200| 60Bh | 0x0005| 60Ch | 0x0024| 60Dh | 0x0000| 618h | 0x0000| 619h | 0x0574| 61Ah | 0x05DC| 61Bh | 0x007D| 61Ch | 0x0000| 61Dh | 0x0000| 61Eh | 0x0000| 620h | 0x0000| 622h | 0x0000| 623h | 0x0000| 624h | 0x5511| 625h | 0x0000| 626h | 0x0000| 627h | 0x0000| 628h | 0x0000| 629h | 0x0000| 62Ah | 0x0000| 639h | 0x0001| 63Ah | 0x0000| 63Bh | 0x0000| 63Ch | 0x0002| 63Dh | 0x0000| 63Eh | 0x0000| 648h | 0x0120| 649h | 0x0001| 64Ah | 0x0010| 871h | 0x00EE| 1000h | 0x0000| 1001h | 0x0004| 1007h | 0x003D| 100Bh | 0x0800| 1012h | 0x0001| 1834h | 0xC000| 1836h | 0x0000| 3000h | 0x0000| 3001h | 0x0004|

  • Hi Miles,

    I see that RGMII mode is enabled in register 0x600. Please let me know which signals you have probed and which do not have any activity. RX_CLK, TX_CLK, RX_D0, TX_D0, etc. Please ensure that ethernet packets are being sent while you are probing.

    Is ping command able to be successful?

    Thanks,

    David

  • There is no data except that RX _ CLK and TX _ CLK have clock waveforms. And the ping command is not able to be successful.

  • Hi Miles,

    I see the RX packet counter (0x63C) is at 2 and TX packet counter (0x639) is at 1. You will need to probe the RGMII lines during continuous data transmission to see the toggling of data lines. 

    You may do this using another DP83TC812 board to generate packets using the following commands:

    0x0624 = 0x55BF
    0x0619 = 0x1555

    Please do this and check that the RX packet counter is incrementing on the Device Under Test.

    Thanks,

    David

  • Hello, do you mean to set the 0x0624 and 0x0619 registers on a DP83TC812 and measure the values of 0x639 and 0x63C on the same board? I have just done a test, that is, I only have a piece of DP83TC812, on the basis of the previously issued register, modify 0x0624 = 0x55BF, 0x0619 = 0x1555. Then print the RX packet counter continuously (0x63C)
    And the value of the TX packet counter (0x639), it is found that the value of the RX packet counter (0x63C) is always 0, while the value of the TX packet counter (0x639) is changing. So that,my test result is that the RX packet counter is not incremented

  • Hi Miles,

    As you can see, the registers given are generating traffic on the TX side. If you connect another DP83TC812 board via ethernet cable, that board will see RX packet counter incrementing, and data will be transmitted to the MAC interface. In this case you can probe the RX_Data lines and see toggling. 

    Thanks,

    David

  • We tried to connect another DP83TC812 board via Ethernet cable, but the board did not see the RX packet counter increase and the data was not transferred to the MAC interface.
    Moreover, we read 83TC812EVM and compared it, and found that the following registers were inconsistent:
    10h | 0x0205 | 0x2005|
    18h | 0x1a25 | 0x5200|
    18Ch | 0x0001 | 0x0000|
    457h | 0xe4db | 0xE581|
    561h | 0x0000 | 0x0801|
    60Ah | 0x06ed | 0x0200|
    639h | 0x02d3 | 0x0001|
    63Ch | 0x00c3 | 0x0002|
    All other register values are consistent.

  • Hi Miles,

    The following register writes can be used on a single board to generate ethernet packets directly on the RGMII interface. Can you please write these two registers on the DP83TC812 and then probe the RX_D0 signal? You may try this experiment first on the EVM and then on your custom board.

    0x0624 = 0x55BF
    0x0619 = 0x1005

    Thanks,

    David

  •   Hello, according to what you said, we have tested the EVM and the board that made by ourselves ,
    set up the environment and write the register, and the test result is that the signal waveform
    can be measured on the RX_D0 pin.

  • The interrupt enable status of home-made board is inconsistent, and the values of link_losses and link_failures are too high and PHYSTS are different. Specifically, Descrambler lock latch low and RxerrCnt0 are inconsistent since last read.clear on read.

  • The values of register addresses 10h, 18h, 18Ch, 457h, 561h, 60Ah, 639h, 63Ch are inconsistent. The meanings of important register differences are as follows:
    Address 10h is the PHYSTS Register, its 9th and 13th bits do not coincide, the 9th is Descrambler lock latch low, and the 13th is RxerrCnt0 since last read.clear on read.

    Address 18h is the MISR3 Register, where bits 0, 2, 5, 11, and 14 are inconsistent, respectively
    The 0 bit is interrupt enable, LPS_int_en
    The second bit is the interrupt enable, wake_req_int_en
    The fifth bit is interrupt enablement, sleep_fail_int_en
    The 11th bit is No Frame detected for transmission or reception in given time, no_frame_int
    The 14th bit is Link has not been observed within time programmed in 0x562 once training has started, no_link_int

    Address 60Ah is the SGMII_STATUS Register, where digits 4-7 and 10 do not agree.
    The 4-7 bits are word boundary index selection, cfg_align_idx
    Number 10 is sgmii autoneg complete indication, sgmii_autoneg_complete

    Address 561h is TC1_LINK_FAIL_LOSS Register, link_losses and link_failures of self-made board are too high.

  • Hi Miles,

    Are you seeing link issues? Is link toggling up and down repeatedly? 

    Please share the home-made board schematic with me. As well as snapshots of the MDI and RGMII layouts.

    Please also go thought this document, this will guide you through troubleshooting this issue: https://www.ti.com/lit/ug/snla431/snla431.pdf 

    Thanks,

    David

  • Our hardware engineer said, homemade plate is refer to the schematic diagram for the design of the official: www.ti.com/.../tidmb63.pdf
    The link has loss and fail immediately after the program is started, and the value of 0x561 is 0x801, respectively. For the next 47 minutes, there were no dropped links, but after 5 hours of placement testing, the dropped links increased significantly, and the value of 0x561 was 0x3c3e

  • Hi Miles,

    Initialization script given in SNLA389  must be written to ensure robust link quality. Can you please confirm if you are writing this script?

    Additionally, please share a snapshot of the MDI layout. I would like to review. Please share the actual schematic as well, I would like to verify that the reference design has been correctly followed.

    Thanks,

    David

  • Hello, do you mean to write script from Table 3-1. Master Mode Configuration in SNLA389 document to phy chip? We have written the values in the table into the corresponding register. The value of register address 0x871 is read as 0x00EE.

  • These three figures are circuit related data

  • Hi Miles,

    Please share the schematic of the MDI section as well. From the layout I can see that external low pass filter is present. This should not be populated for DP83TC812, which has integrated LPF. Please depopulate these components and short where the inductors were populated.

    Have you performed PMA compliance testing? This will validate the MDI performance.

    Thanks,

    David

  • Can you mark which component that we should depopulate?
    What is the PMA compliance testing , can you explain that, thank you!
    the schematic of the MDI section is below:

  • We have tried to remove the components in the yellow wire frame, but found that the link is still the same as before

  • Hi Miles,

    Correct, the components in the yellow frame should not be populated.

    Also, I have noticed you are using TPD1E10B06-Q1, which has very high capacitance (12pF). Please depopulate U11 and U12 and let me know the results.

    Thanks,

    David

  • Hello, we have removed the relevant components according to this, but the link loss fail is still the same as before.

  • Hi Miles,

    Are you able to perform PMA compliance testing on one of the failing boards?

    Thanks,

    David

  • We will perform the PMA testing.
    Additionally, we have found a rather strange issue that the self-made board shows waveforms on the RX_D0 of the RGMII interface during communication with the PC, but the program does not receive any data and the interrupt does not trigger.

  • Hi David,
    after we have removed the components that you mentioned last time ,and configured the registers to be consistent with the 83tc812EVM,

    I found that the link is already fine, and now the values of loss and fail are basically 0. So, shall I still need to do a PMA test ?

    If necessary, how to do this test? We read the SNLA389 pdf document you mentioned last time and found no relevant detailed instructions.

  • Hi Miles,

    Glad to hear the link issues are resolved with the above recommendations. PMA compliance test is not necessary in this case.

    Thanks,

    David

  • Hi David,

    I'm sorry to bother you again. During the next debugging process, we used the enet_cpsw_udpserver routine and communicate directly with the PC using netconn_sendto to send information to the PC. However, we encountered the following error: "Routing problem."

    Here are the detailed debugging information:

    Starting QSPI Bootloader ...

    [14:52:16.539]收←◆[BOOTLOADER_PROFILE] Boot Media : NOR SPI FLASH
    [BOOTLOADER_PROFILE] Boot Media Clock : 80.000 MHz
    [BOOTLOADER_PROFILE] Boot Image Size : 409 KB
    [BOOTLOADER_PROFILE] Cores present :
    r5f0-0
    [BOOTLOADER PROFILE] System_init : 76us
    [BOOTLOADER PROFILE] Drivers_open : 17us
    [BOOTLOADER PROFILE] LoadHsmRtFw : 3us
    [BOOTLOADER PROFILE] Board_driversOpen : 2701us
    [BOOTLOADER PROFILE] CPU load : 23689us
    [BOOTLOADER_PROFILE] SBL Total Time Taken : 26488us

    Image loading done, switching to application ...
    ==========================
    CPSW LWIP UDP SERVER
    ==========================
    MII 3,phy addr:10
    PHY 10 is alive
    Starting lwIP, local interface IP is Static IP
    Host MAC address-0 : 70:ff:76:1d:ec:f2

    [14:52:16.619]收←◆[LWIPIF_LWIP] NETIF INIT SUCCESS
    [LWIPIF_LWIP] Enet has been started successfully
    Enet IF UP Event. Local interface IP:192.168.1.22
    Enet IF UP Event. Local interface Gateway:192.168.1.1

    Interface 6: IP address: 192.168.1.22
    Network is UP ...

    [14:52:16.897]收←◆EnetPhy_getLocalCaps: EnetPhy_getLocalCaps:61

    [14:52:16.991]收←◆MAC Port 1: link up

    [14:52:17.730]收←◆sendPckt sendto: error "Routing problem."

    [14:52:22.733]收←◆ 6.151s : CPU load = 4.05 %

    [14:52:27.733]收←◆ 11.152s : CPU load = 1.63 %

  • Hi Miles,

    I am not familiar with this log. Which processor are you using? It may be better to reach out to the processor team directly.

    Thanks,

    David

  • Hi David,

    We are using AM2732.OK,we will reach it out to the processor team.

    Thanks,

    Miles