This thread has been locked.

If you have a related question, please click the "Ask a related question" button in the top right corner. The newly created question will be automatically linked to this question.

SN65HVD78: cable and sampling rate

Part Number: SN65HVD78

Tool/software:

Hi,

We had a conversation about cable length and sampling rate in the following thread.

When using the SN65HVD78 to communicate at 50Mbps, how long can the cable be used?

https://e2e.ti.com/support/interface-group/interface/f/interface-forum/1357732/sn65hvd78-sn65hvd78-rate-related-issues

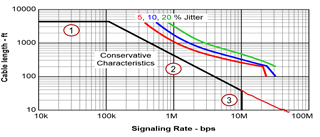
Also, I would like to know about the attached graph.

Regarding the jitter in this graph, the one with less jitter (5%) has a shorter cable length and slower speed than the one with more jitter (20%).

In the graph, the one with more jitter seems to be superior, but I would like to know how to read the graph.

Best Regards,

Nishie

  • When using the SN65HVD78 to communicate at 50Mbps, how long can the cable be used?

    The communication distance is dependent on the overall system. If you use poor quality cables, aren't properly terminating a signal, or using a improper bus topology then the graph you are referencing is not applicable. 

    You can essentially draw a straight line from the graph to estimate the distance it can support. 

    From this, you can likely get less than 10feet (3.3m) reliably. 

    I've personally done testing w/ 50Mbps on a different device and found that 10ft had around 7% jitter and 100 ft had around 25% jitter. (Again, dependent on your system set up but the cable I was using wasn't super high quality).

    Note this was a different device but the concept will be similar:

    This was at 10 feet

    This was at 100 ft

    Regarding the jitter in this graph, the one with less jitter (5%) has a shorter cable length and slower speed than the one with more jitter (20%).

    In the graph, the one with more jitter seems to be superior, but I would like to know how to read the graph.

    You are sacrificing signal quality for higher distance/speed. You can see in my earlier example, at 10 ft the jitter was okay and in most systems would likely have a few bit errors. With a system with 20% jitter, you will likely see a lot of bit errors and the signal may not be usable unless you add CRCs.

    The graph is essentially a guideline that assumes an ideal bus. If your bus isn't set up properly then this graph will not provide any useful information. 

    -Bobby