DS90UB964-Q1: DS90UB964-Q1 why same environment the got different MAP result? is it normal or the device got problem?

Part Number: DS90UB964-Q1

Tool/software:

Hi

Register 0xD4 setting is 0x60
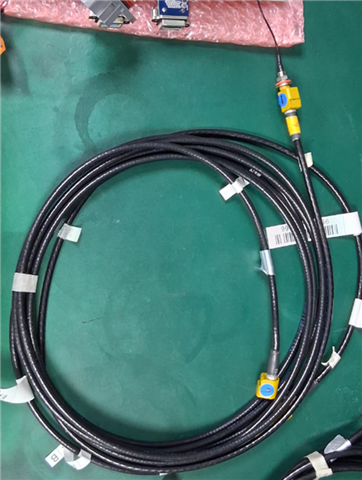
FAKRA cable

IPEX connector

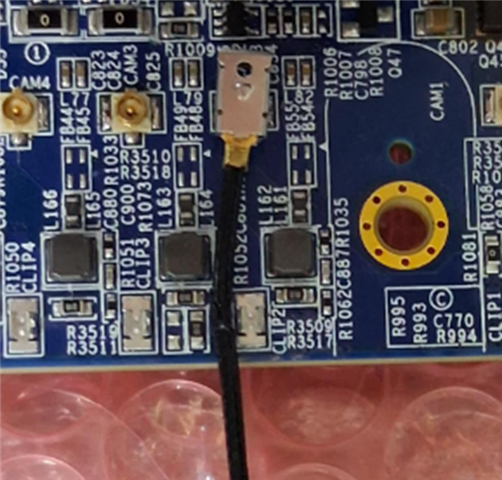
Test condition: DUT (with IPEX connector & cable) +FAKRA cable(1meter+4meter) +camera

Problem Description:
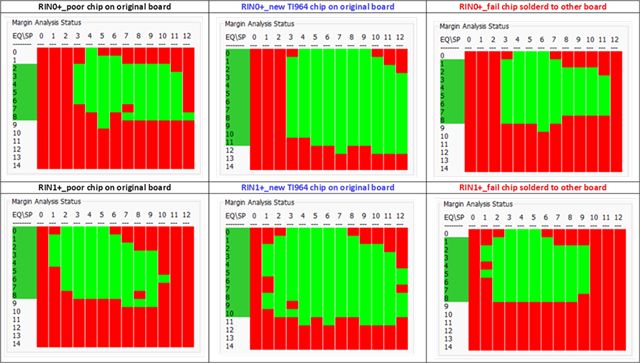
We're using the MAP tool's margin analysis to verify the EQ status of our products. We found that the results for the first two channels of a DS90UB964-Q1 were poor. However, after replacing it with a new DS90UB964-Q1, the results improved.
We'd like to have the poor chip with the poor EQ results tested and analyzed to see if there are any abnormalities.

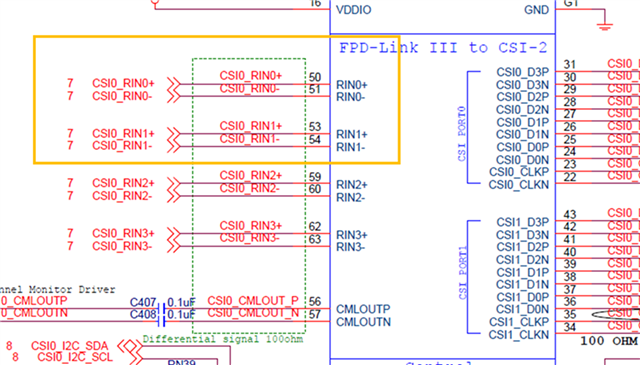
The failure pins are 4 pins from pin 50 to pin 54, as shown in the figure below:

Comparison results of MAP tool margin analysis:

  • Hello Kevin,

    In all of your test results, you are achieving sufficient margin, as noted in the MAP App Note.

    https://www.ti.com/lit/an/snla301/snla301.pdf

    MAP tool works by looping through EQ and strobe settings on the deserializer and dwelling at each setting for a specific time. Then, checking to see if any errors were detected on the link during the dwell time. If there are any errors, then that EQ/Strobe setting will count as a failing result.

    Please note that minor differences in the results are expected across different power cycles and MAP runs. You can run MAP multiple times and average the results to get a better overall picture. But you are definitely passing in all of the tests that you are performing.

    Best,

    Justin Phan

  • Hello Justin,

    Why same environment the got different MAP result ? is it normal or the device got problem ?

  • These results are normal. There will be slight differences between runs. To get a broader picture, you would have to take the same board and run MAP multiple time and then average the results. But just based on the images you shared, there is plenty of margin in each run.

  • The left and middle graphs were run 5 times each and the average results show that the middle graph is better than the left graph. The test board and environment are the same, the only difference is the TI964 chip. Does this mean that it is a chip problem?

  • There may be small individual differences between each chip. But overall, there does not seem to be a chip problem. There is very wide margin shown in each chip tested. If there are any functional issues with the chips that are noticed by the customer, please let us know and we can debug further.