This thread has been locked.
If you have a related question, please click the "Ask a related question" button in the top right corner. The newly created question will be automatically linked to this question.
When using ds90ub953 and ds90ub954 to transmit FPDLINK images, the layout and wiring of 953 terminals are as follows:
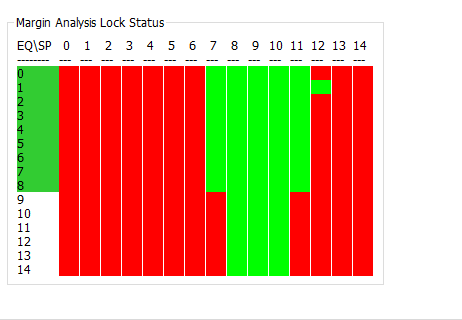
The results of testing with test software are as follows. Seen from the eye chart, do you have any suggestions for improvement?
Eye Figure 1:
Eye Figure 2:
Hi,
The AEQ and S-filter adjust the gain of the signal to counter the attenuation of the signal when being transmitted between the SER to the DES; therefore, the cable length, aging, bending will have more of an effect on the eye chart you are seeing than the PCB. Unless your PCB traces were very poor, have you done the s-parameters on the PCB traces? If that doesn't meet our suggested characteristics listed in Table 227 of the DS90UB954 datasheet, then I would recommend following section 10 (Layout Recommendations) of the datasheet to improve the PCB traces. In general, we recommend having a margin of at least three EQ levels with four passing strobe positions, including a contiguous rectangle of passing states that measures two EQ levels by four strobe positions. In your results above, you meet this criteria. For more information, please see the app note below if you haven't already.
http://www.ti.com/lit/an/snla301/snla301.pdf
Regards,
Mandeep Singh