This thread has been locked.

If you have a related question, please click the "Ask a related question" button in the top right corner. The newly created question will be automatically linked to this question.

SN74LV1T125: Simulation of transition time

Part Number: SN74LV1T125

Hello team,

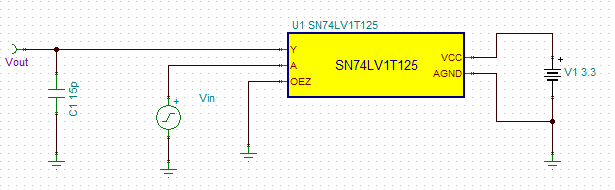
My customer has simulated SN74LV1T125 with below circuit using its behavioral SPICE model provided in its product folder.

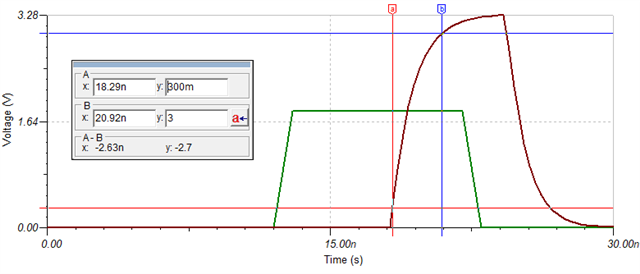
However, the simulation result of transition time is about 300ps and is different from datasheet curve, expected about 3ns. 

  1. Can the model be used for simulating transition time?
  2. Could you advise me if there is any technic to simulate it properly?

[Simulation schematic]

[Datasheet curve]

[simulation result]

Best regards,

  • Hello Sato-san,

    I found two errors in the model that were causing your issue. I corrected them in the below attached version. Here you can see the expected results from the updated version of the model:

    SN74LV1T125.cir

  • Also, I forgot to mention that there must be a load attached to the output to properly simulate transition time -- I used 15 pF for my simulation above.

  • Hello Emrys-san,

    Thank you for correcting the model and advice to simulation load condition.

    Pulse width looks different between input and output.

    Looking at above simulation result, it takes about 4ns to output rising and it seems close to datasheet tpd typ value. However output falling timing seems to be about 1.5ns~2ns and is faster.

    Is the behavior correct as the device performance? or is it due to the simulation model?

    Best regards,

  • Hello Sato-san,

    In this case, the delay circuit in the model is a simple single-stage RC, so it won't be able to accurately model short pulses like this.

    This is a behavioral model - it does not simulate all of the transistors in the device and only gives a representation of the device's operation.

    If you are trying to push the device to see its limits, then you should do that with a real device.