


Hi
I'm trying to calculate the power dissipation for SN74LVTH16245A-EP. I used the equation from the document SCAA029 page 18.
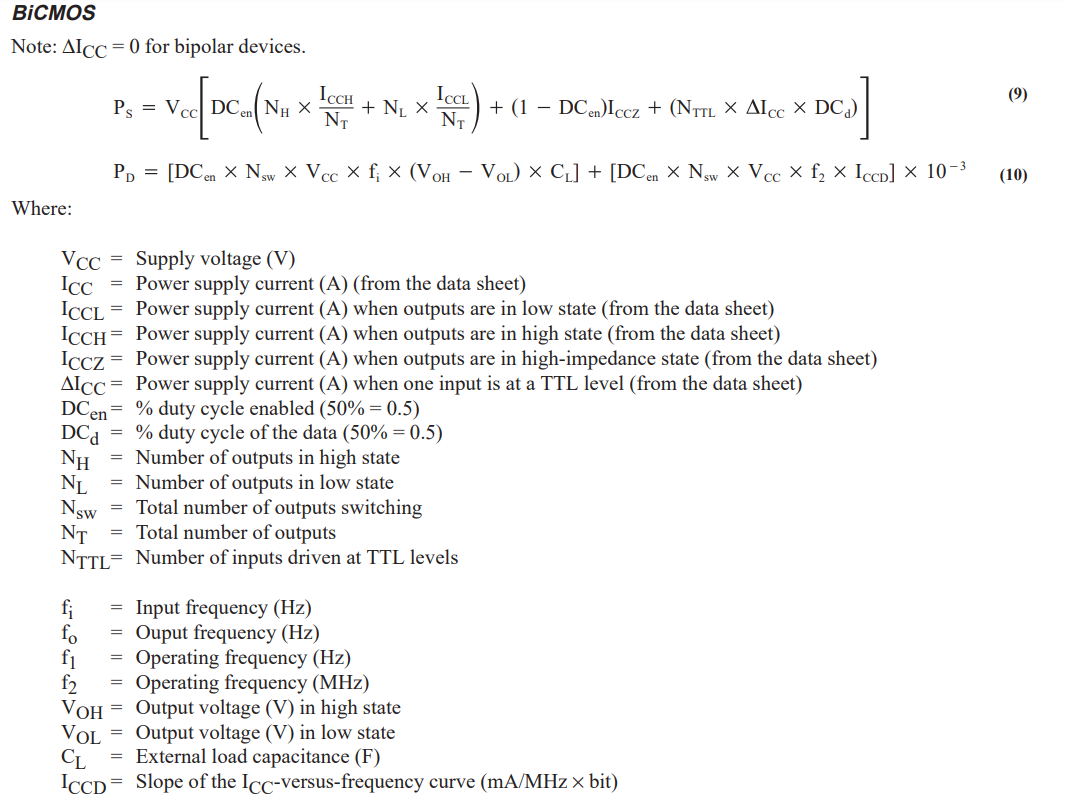
I am having difficulty to figure out the Slop of the I_CC vs frequency curve (I_CCD).
I found 2 plots, and both of them are Icc vs freq for LVT. However, their value doesn't line up. Left plot starts from about 25 mA at 0 MHz, and right plot at about 4 mA at 0 MHz. Why are they different? Which one is correct?
Left plot is from the document SCAA029 page 15. Right plot is from the document SCEA002A page 8.

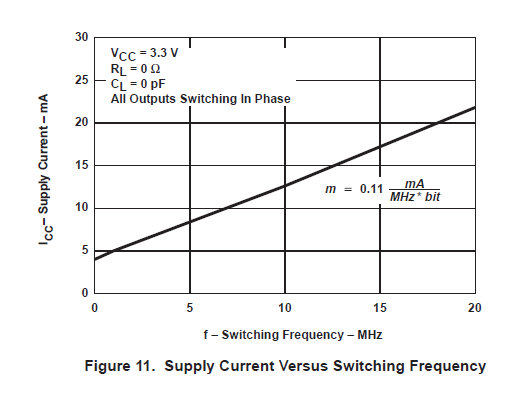
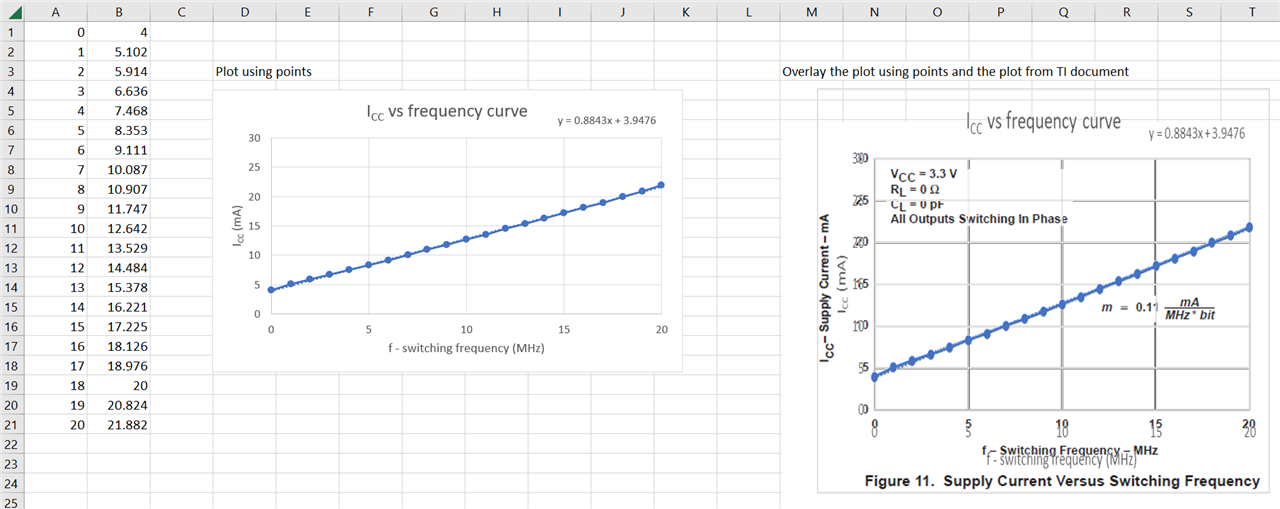
Also, the slop of the right plot doesn't seems right to me. I tried to obtain points from the graph, and plot it in the Excel to get the slope. The slope seems to be closer to about 0.88 instead of 0.11. Could you explain how the 0.11 was obtained?
Reference documents:
SCAA029: https://www.ti.com/lit/an/scaa029/scaa029.pdf
SCEA002A: https://www.ti.com/lit/an/scea002a/scea002a.pdf
Thank you.
