


Other Parts Discussed in Thread: TINA-TI
Team,
Do we have some graph showing how Vt+ threshold will deviate with temperature?
The datasheet gives the min/max and typ value for Vt+ but how does the curve look like? Can we assume that the temperature curve is linear?
Do we have a graph for the power consumption versus the input voltage?
The use case is to have an RC circuit of 3 ms at the input and to generate an edge out of it.
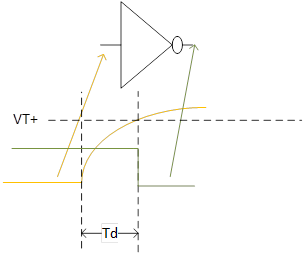
The goal is to evaluate :
-> the impact of the temperature on the Td time.
-> the increase of power consumption due the slow rising edge
Any idea on how to evaluate this?
could TINA-TI/SPICE enable to evaluate this? If yes do we have a model available to test it?
Thanks in advance,
A.

