1. Used quantity and defective quantity (the defective rate should be known)
Total number :4000pcs sampling number :180pcs defective number :37pcs defective rate :20.6%
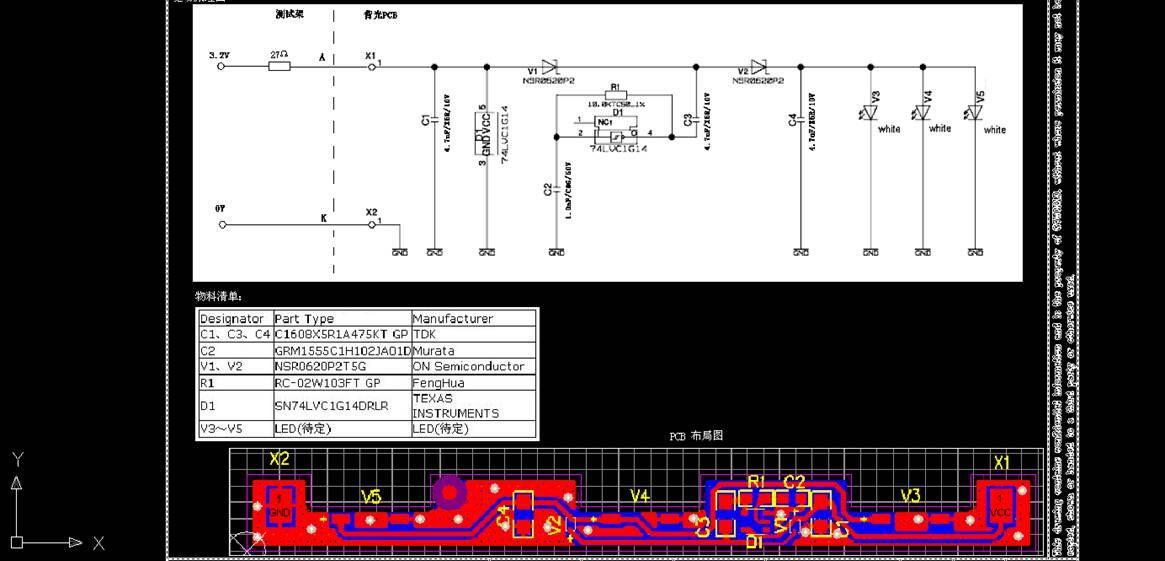
1. Circuit diagram or local circuit diagram of the device
The circuit diagram is as follows
2. The power supply condition of the board, and the specific measurement value of the bigoted voltage of the normal and abnormal boards in the same use environment, as well as the measurement method
OK product test voltage: 3.2v current: 30mA NG product test current: 3.2v current: 7mA
3. Specific cross validation, such as whether the defective chip is normal after being replaced with other materials in the same batch.The situation after the replacement of other batches and the replacement of the defective board chip down, to replace the specific situation of the good board
Cross validation: use the same FPC assembly (same batch of IC), NG after bad IC assembly, OK after good IC assembly, confirmed as bad IC led to dark light;
4. It is better to illustrate the above test process with relevant pictures