This thread has been locked.

If you have a related question, please click the "Ask a related question" button in the top right corner. The newly created question will be automatically linked to this question.

MSP432E401Y: Unable to debug/traverse through the Bootloader code.

Part Number: MSP432E401Y
Other Parts Discussed in Thread: UNIFLASH

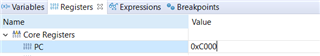
We are using the example UART Bootloader code to jump to the Application which is flashed at 0xC000. We are able to jump to the application at 0xC000, however the concern is that we are unable to debug/walkthrough the BL code at all. Need support regarding the same.


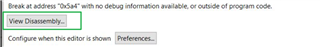
The code is compiled and loaded using CCS and the code doesn't start from ResetISR. Hence, unable to perform a debug operation using breakpoints and traversing through the code. Below is the screenshot of the code after loading the BL code. The .ccxml file selected as "XDS110 Debug Probe", Device "MSP432E401Y"

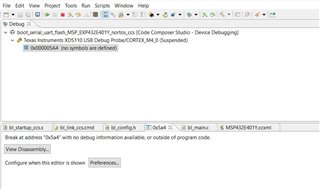
Note: With the same configuration, code traversing works totally fine in the Application code.

However, when target config file .ccxml uses “XDS 110 USB debugger” & Device set as “TIVA TM4C129XNCPDT”. -> This configuration allows the program execution to enter reset ISR. However it goes to a free run after executing ProcessorInit (i.e can't step over right after ProcessorInit executes)

Details of the setup/project
Controller : MSP432E401Y (custom board)

CCS Version : 10.4.0.00006

Debugger : XDS110

Uniflash : To flash the application.hex file

Note : Also tried in the launchpad, same issue as stated above, not at all able to walk-through the code.

Thanks,
Nikita

  • You can do like this and press enter. Then the PC will jump to 0xc000

  • Actually, I am already able to jump from the Bootloader to the Application totally fine which is at 0xC000. 

    Concern is to be able to step-over the bootloader code.

  • Sorry, I am a little confused from your description.

    1. When you are debugging, does the MCU contain bootloader code and application code?

    2. You want to debug the application code. However the application code is downloaded through bootloader when the device in debug mode?

  • Sorry, I am a little confused from your description.

    No issues. Please find the details below. Let me know if other info is required.

    1. When you are debugging, does the MCU contain bootloader code and application code?

    Yes, correct.

    2. You want to debug the application code. However the application code is downloaded through bootloader when the device in debug mode?

    Okay so I have little modifications done to the "boot_serial_uart_flash" example code available. 

    bl_startup_ccs.s (because for now I just want to directly jump to application @0xC000)

        ;;
        ;; See if an update should be performed.
        ;;
        .ref    CheckForceUpdate
        bl      CheckForceUpdate
        ;cbz     r0, CallApplication
        b		CallApplication

    bl_config.h

    #define APP_START_ADDRESS       0x0000C000

    With the above two changes, I compile the bootloader code and load it to flash@0x0000 and meanwhile the application is also flashed@0xC000. And this all working fine, as in BL executes and directly jumps to the application, and my application continues running. This is on free run when debugger is not connected.

    The problem is that when I try to load the bootloader using the debugger and try to step over the code line by line, it goes to a free run after executing ProcessorInit (i.e can't step over right after ProcessorInit executes). If I pause the execution, I get "no symbols defined".

    But logically BL starts up and jumps to the application fine.

  • I am not sure if you erase the application when you load the bootloader using debugger.

    I would advise:

    1. If you want to debug the application alone, you can change the CMD file, or use PC to jump to the entrance of application.

    2. If you want to debug the application when you load the bootloader build file, you can try to load the application build file to see whether it can works.

    I just try the solution 1, if you want to do solution two, you can make a try.

  • I have used the Ethernet bootloader which I believe is similar. The problem is that the bootloader copies itself to RAM, and runs from there. The source code believes it lives at the execution address in RAM, not the link address in FLASH, so you have to pull a couple of tricks until you get to a bit of code that is running in RAM where the debugger knows about it.

    The code starts in bl_startup_ccs.s (in the project's ccs folder).
    The file contains the vector table which points to the ResetISR function.

    ResetISR: .asmfunc
    ;;
    ;; Enable the floating-point unit. This must be done here in case any
    ;; later C functions use floating point. Note that some toolchains will
    ;; use the FPU registers for general workspace even if no explicit floating
    ;; point data types are in use.
    ;;
    movw r0, #0xED88
    movt r0, #0xE000
    ldr r1, [r0]
    orr r1, r1, #0x00F00000
    str r1, [r0]
     
    ;;
    ;; Initialize the processor.
    ;;
    bl ProcessorInit

    If you start the debugger it should stop at ResetISR. Open the assembler debug window you should see something like:

    000032b0:   F64E5088            movw       r0, #0xed88
    000032b4:   F2CE0000            movt       r0, #0xe000
    000032b8:   6801                ldr        r1, [r0]
    000032ba:   F4410170            orr        r1, r1, #0xf00000
    000032be:   6001                str        r1, [r0]
    000032c0:   F7FFFFD8            bl         #0x3274
    000032c4:   F000FBA2            bl         #0x3a0c

    Single step in assembler, 5 steps into ProcessorInit

    You should then see something like:

    00003274:   2000                movs       r0, #0
    00003276:   2100                movs       r1, #0
    00003278:   F2C20100            movt       r1, #0x2000
    0000327c:   F85F2014            ldr.w      r2, [pc, #-0x14]
    00003280:   F8503B04            ldr        r3, [r0], #4
    00003284:   F8413B04            str        r3, [r1], #4
    00003288:   4291                cmp        r1, r2
    0000328a:   DBF9                blt        #0x3280
    0000328c:   2000                movs       r0, #0
    0000328e:   F85F2020            ldr.w      r2, [pc, #-0x20]
    00003292:   F8410B04            str        r0, [r1], #4
    00003296:   4291                cmp        r1, r2
    00003298:   DBFB                blt        #0x3292
    0000329a:   F64E5008            movw       r0, #0xed08
    0000329e:   F2CE0000            movt       r0, #0xe000
    000032a2:   2100                movs       r1, #0
    000032a4:   F2C20100            movt       r1, #0x2000
    000032a8:   6001                str        r1, [r0]
    000032aa:   F04E5E00            orr        r14, r14, #0x20000000
    000032ae:   4770                bx         r14

    The source for this is in the same file:

    ProcessorInit: .asmfunc
    ;;
    ;; Copy the code image from flash to SRAM.
    ;;
    movs r0, #0x0000
    movs r1, #0x0000
    movt r1, #0x2000
    ldr r2, bss_start
    copy_loop:
    ldr r3, [r0], #4
    str r3, [r1], #4
    cmp r1, r2
    blt copy_loop
     
    ;;
    ;; Zero fill the .bss section.
    ;;
    movs r0, #0x0000
    ldr r2, bss_end
    zero_loop:
    str r0, [r1], #4
    cmp r1, r2
    blt zero_loop
     
    ;;
    ;; Set the vector table pointer to the beginning of SRAM.
    ;;
    movw r0, #(0xE000ED08 & 0xffff)
    movt r0, #(0xE000ED08 >> 16)
    movs r1, #0x0000
    movt r1, #0x2000
    str r1, [r0]
     
    ;;
    ;; Set the return address to the code just copied into SRAM.
    ;;
    orr lr, lr, #0x20000000
     
    ;;
    ;; Return to the caller.
    ;;
    bx lr
    .endasmfunc

    The line near the end is where the magic happens!

    orr lr, lr, #0x20000000

    (which looks like orr        r14, r14, #0x20000000 in the debugger)

    is modifying the return address of the function to the equivalent position of the caller but in the RAM copy, Run to that line then single step on and into

    bx lr

    We are now back just after the call to ProcessorInit, but in RAM, and the source debugger seems able to cope from there.

    I assume the UART bootloader is not too different at the start - hope that helps.

  • Hi Jim, thank you for the response.

    The line near the end is where the magic happens!

    orr lr, lr, #0x20000000

    (which looks like orr        r14, r14, #0x20000000 in the debugger)

    is modifying the return address of the function to the equivalent position of the caller but in the RAM copy, Run to that line then single step on and into

    bx lr

    We are now back just after the call to ProcessorInit, but in RAM, and the source debugger seems able to cope from there.

    I assume the UART bootloader is not too different at the start - hope that helps.

    Thank you for the explanation. I was able to step into the source like you suggested.