A related question is a question created from another question. When the related question is created, it will be automatically linked to the original question.
If you have a related question, please click the "Ask a related question" button in the top right corner. The newly created question will be automatically linked to this question.
Looking at the enet_l2_timesync_am243x-lp_r5fss0-0_freertos_ti-arm-clang example from mcu_plus_sdk_am243x_08_02_00_31 I can't seem to find the code which reports the "RX Latency" or "TX Latency" messages.
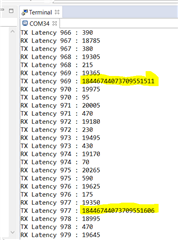
If the very high values are interpreted as signed 64-bit values, rather than unsigned 64-bit values, then the values are small negative values around -100. That might be explained if the timestamps are not monotonic.