Other Parts Discussed in Thread: SYSBIOS
In the .cfg file i am using
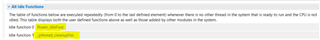
var Idle = xdc.useModule('ti.sysbios.knl.Idle');
How to calculate the time spent in Idle Task over a period of 1sec.
In the .cfg file i am using
var Idle = xdc.useModule('ti.sysbios.knl.Idle');
How to calculate the time spent in Idle Task over a period of 1sec.