This thread has been locked.

If you have a related question, please click the "Ask a related question" button in the top right corner. The newly created question will be automatically linked to this question.

MSPM0G3507: Debugger doesn't work without power cycling the board

Part Number: MSPM0G3507
Other Parts Discussed in Thread: SYSCONFIG, ,

Hello!

We've been using engineering samples until now and had no issues with the debugger (we weren't implementing sleep modes yet).

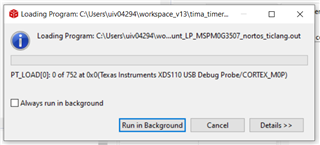
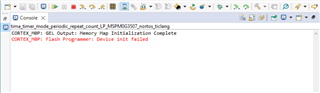
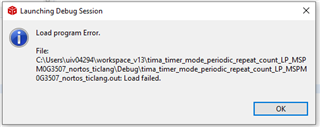
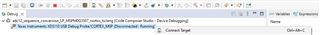
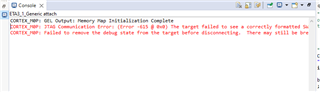
However when trying the updated production samples of this microcontroller I am only able to start debugging once. If I stop debugging from CCS, when I try to start debugging again it gives me the below errors. The debugger is unable to connect to the microcontroller until I reset the microcontroller via reset button or power cycle the board.

This is highly inconvenient since during normal development we debug -> change some code -> debug again for tens maybe hundreds of times during a day, so I would like to avoid this extra step if possible. We did not have this issue on the engineering samples. Is there anything we can do?

Thank you!

  • Hi Florin,

    Do you remember what change you implemented to get to this state?

    Flash the gpio_toggle_output example, run it, then reflash the example again. Let me know if you still get the device init failed, followed by the errors. By reflashing the device with the simple toggle example we will get the device to a good state. If this relieves the problem, try reflashing with your program. If the problem reappears we can take a look at the code.

    Regards,

    Luke

  • Hello Luke,

    The change was switching from an engineering sample to a production one. 2 timers are changed in sysconfig to TIMG6 and TIMG7, because the ones used in the engineering sample no longer exist. But other than that, the entire code is identical. The engineering sample behaves exactly as expected.

    Here's some more digging I did:

    Flashing gpio_toggle_output, then stopping debugging, then starting debugging again, it works perfectly fine 100% of the time.

    Flashing tima_timer_mode_periodic_repeat_count, however does not work perfectly.

    1st time flashing: flashes really fast (few seconds), the example works as expected.

    2nd time and later flashing attempts: it is really slow during the flashing process, remaining stuck at this point for several (10-30?) seconds. 

    I will always get this behavior until I reset the MCU. Then the first time flashing is almost instant, then repeats the above.

    This is similar to what I see in my proper application. However here come the differences compared to my full application. I still get an error:

    but with this timer example it has actually started debugging and I am able to step through code, put breakpoints etc. With my application it was not starting debugging and I had more errors after this one, see 1st post.

    I have removed the lines DL_SYSCTL_enableSleepOnExit(); and __WFI(); from the tima_timer_mode_periodic_repeat_count example code, to rule out debugger losing connection due to sleep.

    HOWEVER

    I have been playing with it some more. My procedure is:

    1. reset the board
    2. set the GPIO_LEDS_USER_LED_1_PIN via sysconfig to PA5
    3. start debugging - everything works fine at this point
    4. set the GPIO_LEDS_USER_LED_1_PIN via sysconfig back to PA0 as it was in the example
    5. rebuild and start debugging without resetting the board. Same scenario as above, flashing is slow and I get the device init failed error but I am able to start debugging
    6. now if I probe with a scope PA0 and PA5, which one is toggling? PA5, of course!

    Looks like when I encounter this error it is not actually able to flash the device, thus the device has the old flash content. However for some reason after flashing fails, it succeeds in starting a debug session with what was previously flashed on the device. I only get this behavior with the timer example, not with the GPIO one.

    I was thinking it might be related to the fact that the timer example uses interrupts. But there is only 1 interrupt every 2s, compared to my application where we would have >5 interrupts per ms, from different sources. I have tried increasing the interrupt frequency in the timer example to 20us, to see if I would get it to no longer be able to start debugging. However no change in behavior, it is still able to start debugging even though it does not correctly flash anything. I have also tried uncommenting the line NVIC_EnableIRQ(). Exact same behavior as above, making me think it may not be directly related to interrupts after all.

    I have tried another example, i2c_controller_rw_multibyte_fifo_interrupts. Same behavior as the timer.

    To sum up, I am not able to 100% reproduce the behavior described in my initial post, but I am able to partly reproduce it with 2 examples from the SDK and there is also 1 other example from the SDK which does not present any issue at all. I am hoping that this gives you more information so that you would be able to check if it reproduces on your side. I cannot publicly share the application code, but I am in contact with a TI representative and I believe I can make something available through him. But seeing as an SDK example is also triggering the problem for me, I don't think sharing our code is necessary yet.

    My tools if it helps:

    • MSPM0G3507 Launchpad, which I only use as debugger connected to our board
    • I have also tried an XDS110 debugger, same behavior
    • Our board with an MSPM0G3507 with 32 pins
    • CCS 12.3.0.00005
    • MSPM0 SDK 1.0.0.04
    • SysConfig 1.16.1
  • Hi Florin,

    I believe you have the wrong support package as it has been updated for the production samples of the device. The flash programmer: device init error is a clear indication of this. 

    I will send you a friend request so I can give you the correct support package for the production device, it will officially be in a future CCS update.

    Regards,

    Luke

  • To everyone finding this in the future, it was an issue with the support package version and it's fixed for me with the updated version 1.00.01.03.

  • Back again. Actually while the updated support package did fix this issue, it is still not fully working for me. Looks like it is unable to flash more than 32kB.

    How to reproduce this:

    1. Get an SDK example. I took tima_timer_mode_periodic_repeat_count
    2. modify the linker file for the flash region like so:
      1. FLASH (RX) : fill = 0xffffffff, origin = 0x00000000, length = 0x00008400
      2. can verify by the map file that the output of the linker really has 0x8400 bytes
    3. attempt to start debugging

    I'm getting this simple error with not much information:

    Also Console window looks like this, no extra info:

    Playing with the length of the FLASH memory in the linker file, any value up to and including 0x8000 works, but any value above that doesn't.

    I have a 3507, so 128kB of flash. I don't think it's a limitation of the actual microcontroller but rather the tooling. Especially considering since in the 1st post here I was able to flash our application of ~45kB on the exact same device.

  • Hi Florin,

    We have identified this and have a new support package. I am sending it through a direct message, let me know if this resolves the error.

    Regards,

    Luke

  • Thank you Luke, this has solved my issue.

  • Hello,

    I use support package version 1.00.01.03. And since I use the new EvalBoard LP-MSPM0G3507 Rev. A there is the same error: first debugger start is good, the next crashes with error

    CORTEX_M0P: GEL Output: Memory Map Initialization Complete
    CORTEX_M0P: Flash Programmer: Device init failed
    CORTEX_M0P: Error: (Error -1001 @ 0x0) Requested operation is not supported on this device. (Emulation package 9.11.0.00128)
    CORTEX_M0P: Trouble Halting Target CPU: (Error -2064 @ 0x0) Unable to read device status. Reset the device, and retry the operation. If error persists, confirm configuration, power-cycle the board, and/or try more reliable JTAG settings (e.g. lower TCLK). (Emulation package 9.11.0.00128)
    .......
    CORTEX_M0P: Unable to determine target status after 20 attempts

    CORTEX_M0P: Failed to remove the debug state from the target before disconnecting.  There may still be breakpoint op-codes embedded in program memory.  It is recommended that you reset the emulator before you connect and reload your program before you continue debugging

    Is there a solutuin for this?

    Regards

    Nikolai

  • Hello,

    Reaching out again since the support package 1.1.1.02, while it is much better, it still gives me these kinds of errors occasionally and disconnects the debugger while in a debug session.

    I have seen it do this for 3 reasons:

    • pulling reset pin low - 100% reproducible
    • watchdog reset - 100% reproducible
    • randomly while debugging for a long time (after 30 min, 1h or more). I have not found the reason for this since it's incredibly random. The sensor 

    When such an error happens, sometimes the debugger completely disconnects with the 20 failed attempts. Other times whatever the sporadic error was, it's still able to step through the code but no breakpoint is hit any more, even if re-applying them. Even in this situation where it doesn't die instantly, it will disconnect completely with the 20 failed attempts pretty soon, usually as soon as I press Resume again.

    Regards,

    Florin

  • Hi Nikolai,

    Can you check for updates on code composer studio, there should be a new IDE patch for the MSPM0 devices. Select help -> check for updates (see below)

    For the Rev A board, make sure you are using CCS 12.3 or CCS Theia.

    Regards,

    Luke

  • Hi Florin,

    It is expected that the device disconnects from the debugger when you reset the device. The device goes through a reset so it will disconnect from the debugger and the debugger won't automatically reconnect. You can reconnect the debugger by right clicking on the Debug probe and selecting connect to target. 

    You can also open up a debug target configuration and connect the debugger from there.  For this option go to view-> target configurations

    Then navigate to your project and right click on the .ccxml file and select launch selected target configuration.

    From here you can right click on the debug probe and connect to target. You can then load the program if you want to reflash the device.

    Debugger disconnects after an extended period of debugging:

    1. Can you send a screenshot of the error messages that appear, or is it the JTAG communication error?
    2. Do you notice a specific instruction/section in code getting reached when the disconnect happens? This well help me replicate the issue, if I can instantly invoke this debug disconnect with code.
    3. Did you clear all the breakpoints and reapply them? There may be artifacts of the breakpoints that lingered from the disconnect, if they aren't properly cleared a POR and reprogram may be required.

    Regards,

    Luke

  • Hello Luke,

    I'll get a screenshot as soon as I see the issue. Until then, a colleague just sent the error code to me by copying the text:

    CORTEX_M0P: Trouble Halting Target CPU: (Error -2064 @ 0x0) Unable to read device status. Reset the device, and retry the operation. If error persists, confirm configuration, power-cycle the board, and/or try more reliable JTAG settings (e.g. lower TCLK). (Emulation package 9.11.0.00128) 
    CORTEX_M0P: Error: (Error -614 @ 0x0) The target indicates there is an error condition from a previous SWD  request. Clear the error the condition, and try the SWD request again. (Emulation package 9.11.0.00128)

    It is very random and I could not trace it back to some specific instruction. Also yes, I tried clearing and reapplying the breakpoints, did not help.

  • Got a different error and debugger disconnected just now:

  • Hi Florin,

    You mentioned the watchdog timer, is your current code implementing the watch dog timer? or did you just test to check for a different reset cause? I want to verify that the watchdog isn't what is causing the disconnect here.

    Also you seeing this on the launchpads or a custom board? If you can verify this happens on the launchpads, I will need your code (or a small section that can replicate this) to help me dig into this further.

    Regards,

    Luke

  • Hello Luke,

    It happens with the watchdog disabled too. Also when I got that error I was tracking some message exchanges sent by our board and it did not send the init messages, meaning it was not reset.

    This is a custom board. I can't verify on a launchpad since we only have ones with early microcontrollers available.

  • Hi Florin,

    Can you replicate this behavior with using the gpio_toggle_output example from the SDK? This will help me see if its a board or code issue. If you can replicate it with the gpio example then I can run the same example on my launchpad and we can rule out the code being the cause.

    We also have LP-MSPM0G3507 available now if you want to order some.

    Regards,

    Luke