This thread has been locked.

If you have a related question, please click the "Ask a related question" button in the top right corner. The newly created question will be automatically linked to this question.

TM4C123GH6PM: IAR debugging EK-TM4C123GXL bootloader failed

Part Number: TM4C123GH6PM
Other Parts Discussed in Thread: EK-TM4C123GXL

I used EK-TM4C123GXL LAUNCHPAD to debug the sample bootloader program.  I successfully compiled the project using the IAR IDE.  The projiect is C:\ti\TivaWare_C_Series-2.2.0.295\examples\boards\ek-

tm4c123gxl\boot_serial. Before downloading the program, I first erase the entire FLASH of TM4C123 to ensure that no other applications reside.I can successfully download the bin file to the launchpad and enter the

debugging interface. But the program entry point is not ResetISR , Instead, it directly enters other applications. Next, I will click on single step or run,The program may encounter unknown errors. Please help me improve

how to resolve this exception and use iar ide to debug the bootloader program.

Thanks !

  • Hi,

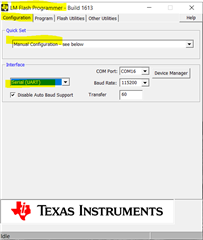
      Boot_serial is a bootloader. You first load it through JTAG interface. Once the bootloader is running, it will listen to command to download your application firmware through the UART interface. The boot_serial uses UART0. You can use LM flash programmer to download your firmware. See below configuration. The COM port will be different. Mine shows up as COM16, you will need to select the COM port that your LaunchPad is enumerated on your PC. 

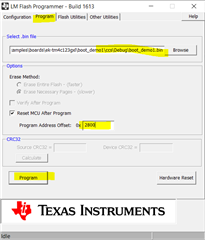
    Next you go to the Program tab and enter the path to the boo_demo1.bin example application firmware. See below. The offset address is 0x2800. After you hit the Program button, the example firmware will be downloaded by the bootloader and programmed to the flash. 

    Once the application firmware is loaded, the bootloader will jump to the application after a reset cycle as it finds a valid stack pointer and reset vector at 0x2800. The example application will simply blink the LED. This is how the example is designed to behave. 

  • Thank you for your reply. Perhaps my description was not very clear, but the problem I encountered was that I was unable to debug the bootloader program

    using the IAR IDE. As I will do some custom work on the official sample program in the future, I need to have the ability to enter breakpoint debugging.

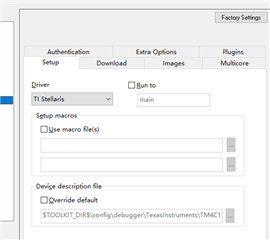
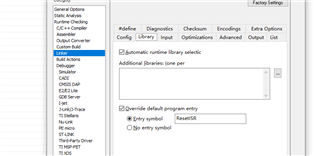
    I will use the following pictures to describe my needs in detail:

    1. I disable  "Run to main " in the iar ide.

    2. Changed the program entry point to ResetISR

    3. Set breakpoint file bl_ Startup_ In ewarm. S

    4. Download the program and run it,I expect the program to stay at the breakpoint I set in step three.But the program directly jumps to the program

    location in the following image.

    5. If I click on Run, the program will fall into the program position shown in the figure below and cannot jump out.

    The above is the phenomenon of the problem I encountered. I have considered it may be related to the configuration of the ICF file or the settings in the IAR IDE.

  • Hi,

     Can you put your breakpoint in the disassembly window instead of the C source editor? What do you see? 

     Can you do a reset and simply single step in the disassembly window? What do you see?

      Can you repeat the same using the CCS? 

    I'm not familiar with IAR as this is a 3rd party IDE. If you think it's more a IAR setting issue,  You might need to contact IAR for support. 

  • I used the CCS IDE to debug the same project and everything was fine.So I think the IAR IDE skipped some steps during program initialization in debugging

    mode. Causing incomplete running code, leading to this situation.