This thread has been locked.

If you have a related question, please click the "Ask a related question" button in the top right corner. The newly created question will be automatically linked to this question.

AM2634: Strange behavior of AM2634 when using Uniflash

Part Number: AM2634
Other Parts Discussed in Thread: UNIFLASH

I am developing quad core application using AM2634

First core(0-1) application is motor control.
Second core(0-2) is userd for monitoring.
Third core(1-1) is used for motion profile.
Fourth core(1-2) is used for communication.

Now, we only use first and second core for testing. But we found strange behavior of AM2634.
There were no problems during initial development. However, as the amount of code gradually increased, abnormal operations occurred frequently.
If I load and run the program using "JTAG", it operates normally. However, when running the application using UART Uniflash, AM2634 behaved unexpectedly.

The first problem is that the core does not work. Sometimes the first core doesn't work and sometimes the second core doesn't work. At this time, when I change any code, the core operates again. Code changes include deleting or adding any lines or even changing the value of a variable from 100 to 200. It is unclear which cores are not working.

The second problem is that sometimes the peripheral does not work. For example, SPI communication does not work or PWM ISR does not occur. In this case, if you change the code as in the first case, it may work.

In all cases above, when using "JTAG", it operates normally without changing the code.

  • Hi ,

    Do you have a map file for the applications ? Can you check if all the sections are palign(8) ? RPRC image poses a restriction that the image should have each sector palign(8). Check MCU+ SDK linker for the same.

    If yes, then you can choose to use JTAG Uniflash for the same. Here is an FAQ for the same - https://e2e.ti.com/support/microcontrollers/arm-based-microcontrollers-group/arm-based-microcontrollers/f/arm-based-microcontrollers-forum/1227707/faq-mcu-plus-sdk-am263x-faq-how-to-flash-the-application-via-jtag-or-sbl-jtag-uniflash

    You can also verify in the same if the application if flashed correctly.

    Do let me know if you have any updates !

    Best Regards,
    Aakash

  • Hi Aakash Kedia,

    Thank you for your answer.

    The linker.cmd of the project is set to palign (8) with all sections.

    I will upload the files. I hope it will be a reference.

    Do I have more to check?

    files : map and linker file

    Best Regards,

  • Hi ,

    Did you try flashing via JTAG ?

    Best Regards,
    Aakash

  • Hi Aakash Kedia,

    I used JTAG(XDS2xx USB debug) to flash. and..

    I also used UART.

    In two cases, the result was the same.

    Best Regards,

  • Hi Jae-seok Cha,

    When using JTAG, what is your core reset release sequence ?

    In SBL-QSPI example, the cores are released in the following sequence - R51-0, R51-1, R50-1 and R50-0. Does this sequence works for you via JTAG ?

    Best Regards,
    Aakash

  • Hi Aakash Kedia,

    I am using a test version project that operates in R5 0-0 and R5 0-1.

    When using JTAG, I usually release in the order of R5 0-1-> R5 0-0.
    And I use IPC Notify in the test version project.
    It doesn't think that the sequence of release the core is important because it waits until all core works.

    Is this right?

    The API used is ipcnotify_syncall (); It is used after the Peripheral setting is completed.
    This is the same in both R5 0-0 and R5 0-1.

        Drivers_open();
        Board_driversOpen();
    
        /* Wait for all cores to start */
        IpcNotify_syncAll(SystemP_WAIT_FOREVER);

    Best Regards,

  • Hi ,

    This sounds about right. I am not able to deduce any problem.

    Can you take the ram dump after the load_cpu command via SBL as well as JTAG load ? Does the dump look similar ?

    Best Regards,
    Aakash

  • Thanks for your answer!

    Can you tell me how to do RAM DUMP?

    I can check it through 'Memory Browser' or 'Save Memory' when debuging with JTAG in CCS.
    However, how can the Appimage loaded in Flash through the SBL-QSPI after QSPI BOOT access to the memory?
    Can you tell me in detail?

    To confirm the problem, send '.out' and '.appimage' files.
    Is it possible to infer the problem through these?
    Please check your personal message.

    Best Regards,
    Jae-seok Cha

  • Hi ,

    Essentially if you open 'Memory Browser' and 'Save Memory' in entire 2MB of RAM space after the *.out file load via JTAG and post load_cpu function in SBL then the RAM should look exactly the same.

    We are trying to trim it down if that is the case or not ?

    Best Regards,
    Aakash

  • Hi Aakash Kedia,

    I am a co-worker of Donggu Kang and Jae-seok Cha.

    I tried what you told us.

    After loading the *.out file using jtag, the contents of Core 0_0 and Core0_1 were saved and

    When posting load_cpu function in SBL, the contents of core 0_0 and core 0_1 were also saved.

    the contents of core 0_0 are cut from 7004_0000 to the size '0xe150(Found according to multicore file format)

    the contents of core 0_1 cut from 700C_0000 to the size '0x9BC8'

    Next, I compared each them and they were exactly the same.


    These are data obtained through 'save memory'.

    core_contect.zip

    Do I have anything to do again?

    Best Regards,
    sinyeop Go

  • Hi Sinyeop,

    the contents of core 0_0 are cut from 7004_0000 to the size '0xe150(Found according to multicore file format)

    the contents of core 0_1 cut from 700C_0000 to the size '0x9BC8'

    Can you elaborate on this more ? It should be exactly the same image. Is it not ?

    Best Regards,
    Aakash

  • https://dev.ti.com/tirex/explore/node?node=A__AD2nw6Uu4txAz2eqZdShBg__com.ti.MCU_PLUS_SDK_AM263X__aBmeCqF__LATEST

    The created multi -core image (.appimage) was split according to the multicore file format.

    At that time, we found the booting image we are looking for in Section 2 of each RPRC file (Core0_0, Core0_1 rprcimage).

    The image was exactly the same when the multicore booted in RAM with SBL or jtag.

    The boot image uploaded to the SBL was found in the 7004_0000 offset set by the linker and the image size was found in the image header (size: 0xe150).

    Similarly, the image of the Core0_1 was found in the 700C_0000 offset set in the linker and the size is 0x9bc8.

    Thank you

    Best Regards,

    sygo

  • Hi sygo,

    The image was exactly the same when the multicore booted in RAM with SBL or jtag.

    If the image is exactly the same, what is the change when you try to run it via jtag vs SBL ? I still do not have enough information to judge what is failing and why is the same failing ?

    Best Regards,
    Aakash

  • Hi Askash Kedia,

    There are currently several unconfirmed issues, one of which is that the pwm sync out from the p2 pin is not output.
    However, when running via jtag, the signal is output normally.
    Could you please check if we send the appimage and out file?

    Best Regards,

    sygo

  • Hi Sygo

    It is very difficult to track if you inquire about multiple issues in Topic Thread, which you have seen so far.
    It would be nice if you could create a new ticket by attaching the results/logs as a reproduction route for each test case.

    Hi Aakash

    They said the issues are reproducile from their environment in QSPI Boot mode even CCS debug mode works as expected. 

    Can you please check if qspi bootloader make different behaviour like customer raised.

    Many Thanks.

    Regards, 

    Jack

  • Hi Sygo and Jack,

    Can you please check if qspi bootloader make different behaviour like customer raised.

    Theoretically. It should not.

    Sygo can you share these things -

    1. Out files for each cores
    2. Final app image created

    I already have the map file/linker file and I don't see any problem with the same as of now.

    Best Regards,
    Aakash

  • Hi Aakash Kedia,

    We will send you a zip file.
    drive_0_0.out is the motor control out file for core 0_0, and debug_0_1.out is the monitoring out file for core 0_1.

    Best Regards,

    sygo

    outnappimage.zip

  • Hi sygo,

    Let me take a look at the images and get back to you in a day. Meanwhile, I think that the weird behaviour regarding the peripheral not turning on between QSPI vs JTAG boot might be a timing issue. In case of QSPI, the cores are booted in this order:

    R5FSS1_1 -> R5FSS1_0 -> R5FSS0_1-> R5FSS0_0.

    Where as in JTAG it will be whatever order you manually load the .outs. Another possibility is the usage of GEL files to enable peripherals. When you use JTAG, are there any GEL files being run?

    Regards,
    Anand Mahadevan SS

  • Hi, Anand Mahadevan SS

    We also load in JTAG in this order.

    R5FSS0_1-> R5FSS0_0.

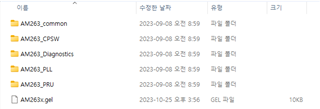
    When we use JTAG, Gel files we use are these.

    Regards,

    sygo

  • Hi Sygo,

    I need to see if there are any peripheral/PLL power inits not taken care in the application but goes through in JTAG mode because of GEL inits. Can you try out these two things:

    1. If possible send me project itself, or maybe the ti_power_clock_init.c generated files for all the core images
    2. Try booting with SBL NULL. In this case, you would still be loading the images manually, but the SoC init will be done by SBL.

    Regards,
    Anand Mahadevan SS

  • Hi Anand Mahadevan SS,

    Is there a path to receive a project with a personal message?

    We do not want the project to be open to this thread.

    and Can you check this case?

    You can check that it works as follows when using Debug Mode as JTAG
      -GPIO K3 Blinking
      -GPIO V17 BLINKING


    When using Qspi Boot, you can check to work as follows.
      -GPIO K3 Blinking
      -GPIO V17 MALFUNCTIONING
    QSPI BOOTIMAGE uses SDK Prebuilt

    am2634_out_files_231201.zip

    This is an experimental file.

    Regards,

    sygo

  • Hi Sygo,

    Thank you for the file. Let me check and get back by tomorrow.

    Regards,
    Anand Mahadevan SS

  • Hi Sygo,

    Apologies for the delayed response. I was unable to see any issues trying to boot the appimage which you had sent. And I did this with SBL QSPI. Did you try out the SBL null method like I had suggested?

    Regards,
    Anand Mahadevan SS 

  • Hi Anand Mahadevan SS,

    Thank you very much for checking the problem.

    We have initialized the development environment and regenerated the project over the last few days.

    The reason for this is that we are doing strange behavior only when we test.

    In the development process, i think that the version and the development environment such as tool and source were not set well.

    As a result, there was a change of strange behavior.

    The strange behavior that occurs during the QSPI BOOT we mentioned is not confirmed.

    It seems to have to continue the repetitive test.

    So we will test and develop in the initialized development environment and monitor.

    If a strange behavior occurs again, it will be reviewed again. And if necessary, I will register as a new issue again.

    Thank you again for the active support of TI.

    Best Regards,

    Jae-seok Cha

  • Hi Jae-seok Cha,

    Thanks for the response, I believe we can close the thread then. Like you mentioned, you can open a new thread if the behaviour occurs again.

    Regards,
    Anand Mahadevan SS