Part Number: RM57L843
Hi,
I'm using a RM57L843, CCS 12.5.0.00007 with TI V20.2.7.LTS ARM Compiler, LE.
I had to debug an application because we determined a seemingly trivial function was not being called during some system level validation tests..
A image of my function call is shown below. I'm passing in a U32, U8, U32 and a pointer.
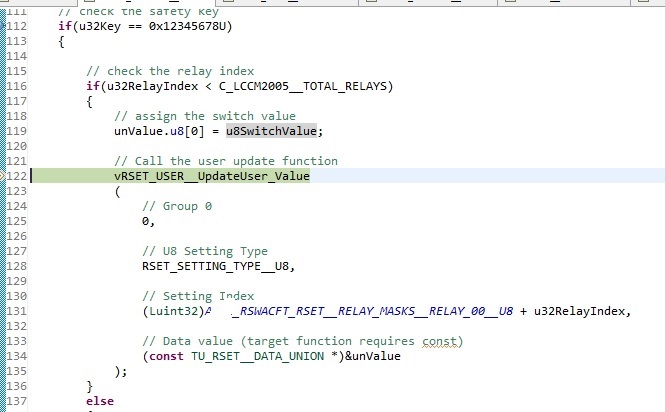
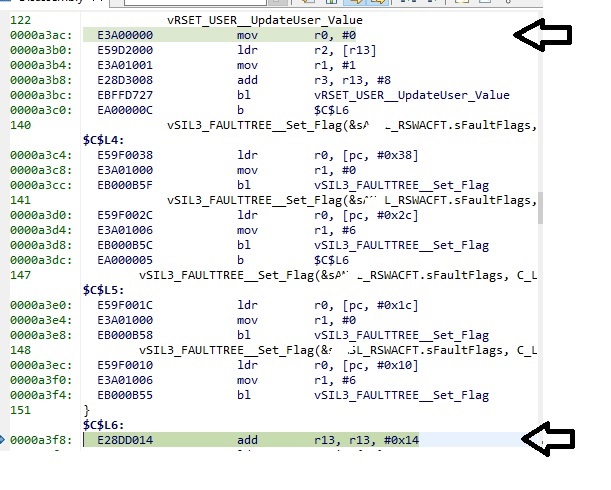
I also note the disassembly listing just just before the CPU should branch to my function
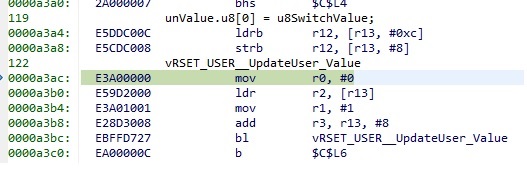
When I step in the C code window, the function does not get called and my cursor ends up at the end of the calling function:
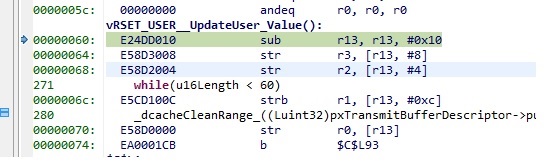
Interesting to note that the function in question seems to be the first function linked at FLASH address 0x60:

I know from our testing, that the structure within the target function call is not being updated, so even during run time (i.e. without the debugger attached) we can see on a system level that the function is not getitng called.
The calling function is entered after some lengthy stack calls, and I'm not sure if that is contributing to the issue, however other functions with the same calling method and call depth work just fine. (I don't think the call depth is too excessive)
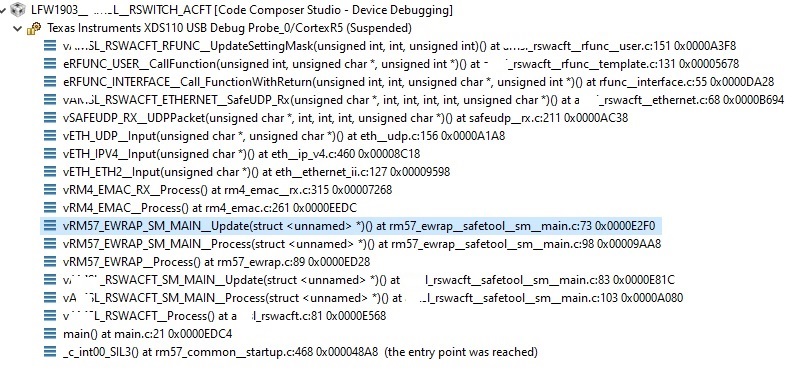
When I step in the dissasembly window, using instruction stepping mode, the CPU will enter our function
But the actual code at that function is from another module (the code shown above is actually part of a ethernet driver), and as soon as I get into that target function it looks like the stack is gone or the CPU is lost.

The linker stack size is 0x3000 and the current stack pointer is at 0x080023D0, so I don't think we are seeing a stack overflow (and there is no reason either, we are not passing lots of memory between function calls). I am not in interrupt context, this is a mature code base, and the issue is repeatable.
So looking for some help from TI as to what on earth could be causing this issue, espeically in a safety CPU.
Thanks!.