This thread has been locked.

If you have a related question, please click the "Ask a related question" button in the top right corner. The newly created question will be automatically linked to this question.

AM2432: EteherNet/IP stop communication after unplug Ethernet cable

Part Number: AM2432

Hi expert,

We use IND_COMMS_SDK to build our EtherNet/IP application.

Part Number : AM2432 BKFGHIALXR (400Mhz R5F)

SDK Version : 09_02_00_08

Project : {IND_COMMS_SDK}/examples/industrial_comms/ethernetip_adapter_demo/generic_device/mii/am243x-lp

We use this application to connect Rockwell PLC, and it will create IO connection.

When we unplug Ethernet cable directly, the net LED become blink red. (connection timeout)

But we re-plug the Ethernet cable, the net LED is still blink red and we can't PING our device.

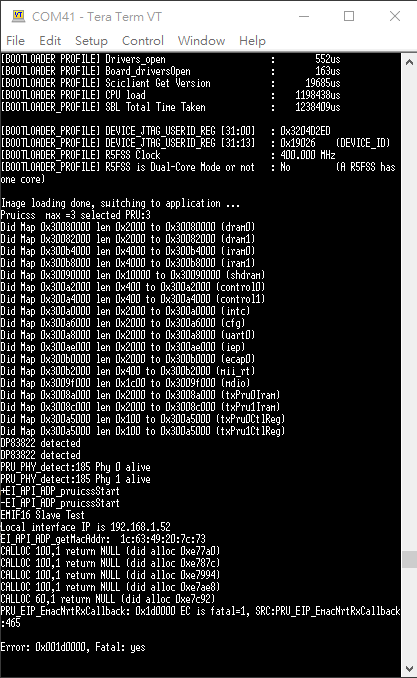
The communication is stop, and we can see error log "PRU_EIP_EmacNrtRxCallback".

Do you have any advice?

Thanks,

Joshua

  • Hi Joshua,

    Thank you for your query.

    I have directed your issue to the domain expert, they will get back to you shortly.

    Regards,

    Nitika

  • Hi Joshua,

    Can you please explain the frequency of this issue?

    Do you see this issue happen every time or is it something that happens sporadically?

    Regards
    Archit Dev

  • Hi Archit,

    We have 6 nodes to connect with Rockwell PLC to test the long time verification.

    This issue is happen randomly in 3 - 6 hours with different phenomenon.

    This is difficult to monitor the UART log of 6 node.

    Can you provide the variable or API that we can monitor EIP stack?

    We find same issue [OSS1-3213] in EtherNet/IP Adapter release notes 3.07.03. 

    Thanks,

    Joshua

  • Hi Joshua,

    Thank you for the explanation.

    I will check this internally with our EthernetIP stack team and get back to you.

    Your patience is really appreciated.

    Regards
    Archit Dev

  • Hi Joshua,

    We tried to reproduce the issue on our end with the cable disconnect but we were unable to do so.

    In order to help better we'd like some more information. Can you please answer these:

    1. Can you please explain the test steps which have been causing the problem?
    You mentioned that cable disconnect is something that was causing the issue - can you describe how often do you disconnect and reconnect the cable?

    2. 
    This issue is happen randomly in 3 - 6 hours with different phenomenon.

    Can you please explain these different phenomena?

    3. Do you only see the issue when cable disconnect is involved, or have you ever seen this issue without it as well?

    4. Are you using the out-of-box example from the SDK for this test? If no, can you please share the map file? Also, will it be possible to share the application changes made to add or update the objects, attributes and instances?

    5. Also, as one of the suggestions from our stack expert, can you try to activate the memory trace log?

    You can activate it by going to the Project Properties of your CCS project and add the following symbol under “Predefined Symbols”:

    CMN_MEM_TRACE=1 (see picture below)

    Afterwards the project needs to be rebuilt.

    By default when activated, the UART log starts to be generated in runtime and when a hard error occurs the actual full memory trace log is generated.
    In this case the runtime log is not needed because in time of initialization or communication, it can be updated too often.

    To switch off the runtime log you need to comment out the line with CMN_BOARD_init call in EI_APP_TASK_main function.
    With steps above the UART log with memory trace will be generated only when error occurs.

    To be able to check whether memory trace is working, you can put following line somewhere to the application side (normally I’m using it before main cycle in EI_APP_TASK_main):

    OSAL_error (__func__, __LINE__, OSAL_STACK_INIT_ERROR, true, 0);

    The project needs to be again rebuilt.

    When you are sure that memory trace is working, you need to remove the previously added OSAL_error line, rebuild the project and just start your tests.

    When the issue occurs again, you will have the memory trace in the UART log. Can you please share this UART log with us?

    Regards
    Archit Dev
  • Hi Archit,

    Our test case is multi-node long time test, and we use Rockwell PLC and 6 AM243 nodes.
    The topology is daisy-chain:
    Rockwell PLC -> node 1 -> node 2 -> node 3 -> node 4 -> node 5 -> node 6
    The current status is that we can't run 72 hours,
    and there have 3 fail scenario.

    1. Some node seem crash
    EI_APP_GENERIC_DEVICE_run() stop. (We added the increment counter in EI_APP_GENERIC_DEVICE_run function)
    Ethernet stack stop. (We can't use other network device to PING this node successfully)
    CIP stack stop. Rockwell PLC can't connect this node

    2. Some node Ethernet Switch Fail
    EI_APP_GENERIC_DEVICE_run() / Ethernet stack / CIP stack work normally,
    but the packet seems can’t pass through one of AM243 internal switch.
    After we unplug the Ethernet cable and re-plug it, the Ethernet / CIP connection can re-creation again.

    3. Some node CIP Stack Fault
    CIP connection is stop, but Ethernet application still can work (PING Device successfully).
    The Module/Network indicator status stop updated, so user application can’t detect disconnected of CIP connection.

    Because these fail scenario is random, and there need 3 - 6 hours to reproduce.
    We try to use other way to reproduce there issue.
    The Un-plug and re-plug test is one of our way to reproduce, but it also difficult to reproduce.
    The UART we show is one of successful case that we catch the log when problem occur.

    Could you explain what we get this error log?

    We set up 6 USB to UART device try to monitor log at the same time.
    We will try to activate the memory trace log, and try this case again.

    Thanks,

    Joshua

  • Hi Joshua,

    Thank you for the detailed response. I will communicate the same to the EIP Stack team and get back to you with their recommendations.

    Your patience is appreciated.

    Regards
    Archit Dev

  • Hi Joshua,

    Regarding the issue number 1:
    One important thing to note about the solved issue [OSS1-3213] (CALLOC failure) is that, the error you see right now in your use case, is with high probability a symptom of some other failure. For example, this bug was caused by a thread-unsafe call to CALLOC/MALLOC and as a result messing up the heap memory. And when the PRU_EIP_EmacNrtRxCallback was called later, it would fail.
    The reason I bring that up is that ANY thread-unsafe dynamic memory allocation might show the same symptom. So, if your code uses dynamic memory allocation or you are using some 3rd party libraries which might use heap memory, please make sure every call related to dynamic memory allocation is thread-safe.

    Thanks

    Pourya

  • Hi Pourya,

    Thank you for your reply.

    The user code which I add use static memory.

    Do you have any method to trace thread-unsafe call of CALLOC/MALLOC?

    [OSS1-3213] is occurred in Kunbus EtherNet/IP library.

    Maybe this library has another risk, but we can't get the source code.

    Thanks,

    Joshua

  • Hi Joshua,

    you could use PC-Trace to see function calls during a debug session, you need to compile for debug configuration. The tool is under Tools->Hardware Trace Analyzer->PC Trace. After a breakpoint is hit or debug session is paused you can investigate the "Trace Viewer".
    the [OSS1-3213] is already resolved.
    The reason I made the remark about this issue, was to make you aware, where you could look out.
    Please share with us the memory trace log we asked a few days ago, and if you managed to have a "Trace View" result, it would also be very helpful to pin down the problem.


    Thank you

    Pourya

  • Hi,

    Multiple stability issues related to dynamic memory allocation have been fixed in the Industrial Comms SDK v 9.2.0.15. I'd suggest you to check it out.

    Download Link: https://www.ti.com/tool/download/INDUSTRIAL-COMMUNICATIONS-SDK-AM243X/09.02.00.15 
    Release Notes: https://software-dl.ti.com/processor-industrial-sw/esd/ind_comms_sdk/am243x/09_02_00_15/docs/am243x/ethernetip_adapter/eip_releasenotes.html 

    Please be aware that there can be some deadlock conditions when accessing I2C0 from the example due to I2C driver not being thread-safe. As a workaround, GPIO based LEDs can be used depending on the hardware.

    Regards
    Archit Dev