This thread has been locked.

If you have a related question, please click the "Ask a related question" button in the top right corner. The newly created question will be automatically linked to this question.

TM4C1237H6PZ: DBG Hard Fault

Part Number: TM4C1237H6PZ

Tool/software:

Hi,

I'm dealing with a hard fault which currently prevents me from being able to validate the application.

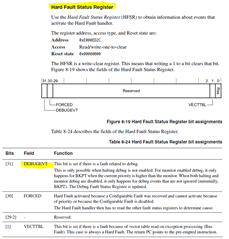
At each reset the FAULT_STAT register is all zero.

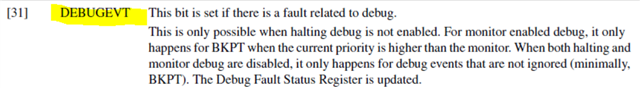
Instead, the HARD FAULT STAT register is always at zero, but when the ISR hard fault is triggered the DBG bit is at 1 (only that).

In the datasheet it is written that the bit is reserved for DEBUG but the application is not in debug.
And I can't find additional information for this type of hard fault.

I therefore ask if you can elaborate on the meaning of this bit, and the possible causes of it
Set to 1.

Looking forward to your kind reply,

Best regards.

  • Hi,

      I'm not sure why only DBG is set but none others. Normally, I will expect additional bits to set. .If you single step, will you know at the line of code that caused the fault to occur. Normally, a hard fault is a result of 1) not enough stack and 2) accessing a peripheral that is not yet enabled. Therefore, make sure you only access (e.g. read or write) to a peripheral register after the peripheral is enabled and reserve enough stack such the processor does not go out of bound on the stack memory. Try to increase your stack and see if that makes any difference. Refer to this app note that diagnose fault exceptions. https://www.ti.com/lit/pdf/spma043

     Below are additional scenarios that can cause hard fault. 

    Lockup
    The processor enters a lockup state if a hard fault occurs when executing the NMI or hard fault
    handlers. When the processor is in the lockup state, it does not execute any instructions. The
    processor remains in lockup state until it is reset, an NMI occurs, or it is halted by a debugger.

    Caution – If the Cortex-M4F Debug Access Port (DAP) has been enabled, and the device wakes from
    a low power sleep or deep-sleep mode, the core may start executing code before all clocks to peripherals
    have been restored to their Run mode configuration. The DAP is usually enabled by software tools
    accessing the JTAG or SWD interface when debugging or flash programming. If this condition occurs,
    a Hard Fault is triggered when software accesses a peripheral with an invalid clock.

  • Hi, 

    I've tried to reduce stack in order to trigger a hard fault, and in that case i have BFARV, BSTKE,PRECISE bits of FAULT_STAT set, and also FORCED bit of HARD_FAULT_STAT set and DBG bit is zero,

    I'm quite sure i'm not using unitialized peripherials, because this hard fault occurs randomly and not in a particular part of the APP code.

  • Hi,

    because this hard fault occurs randomly and not in a particular part of the APP code.

    Ok, you can rule out uninitiated peripherals as the cause. The area to look at will be the memory. Again, try to increase your stack and heap especially if you are using some type of dynamic memory allocation that can lead to faults if not properly allocated I know you have tried to reduce stack size to shorten the time to get a hard fault. Try to increase the stack and heap and see if they delay the faults from occurring. This way you will know if the fault is related to the memory. 

    You can also refer to Arm TRM about DEBUGEVT bit. 

  • Hi, 

    Ok i'm going to try to expand heap and stack.

    How can i change the heap dimension? i'm using CCS

    Thanks.

  • See below example where I set 1024 for heap and 2048 for stack. I don't know what your existing settings. Try to increase them and see if they make a difference and later fine tune the size. 

    In the .cmd file you need to account for the new stack size so the Stack Pointer points to the right address. 

    /* The starting address of the application. Normally the interrupt vectors */
    /* must be located at the beginning of the application. */
    #define APP_BASE 0x00000000
    #define RAM_BASE 0x20000000

    /* System memory map */

    MEMORY
    {
    /* Application stored in and executes from internal flash */
    FLASH (RX) : origin = APP_BASE, length = 0x00040000
    /* Application uses internal RAM for data */
    SRAM (RWX) : origin = 0x20000000, length = 0x00008000
    }

    /* Section allocation in memory */

    SECTIONS
    {
    .intvecs: > APP_BASE
    .text : > FLASH
    .const : > FLASH
    .cinit : > FLASH
    .pinit : > FLASH
    .init_array : > FLASH

    .vtable : > RAM_BASE
    .data : > SRAM
    .bss : > SRAM
    .sysmem : > SRAM
    .stack : > SRAM
    }

    __STACK_TOP = __stack + 2048;

  • Hi,

    I'm using GCC compiler with GNU linker options,

    Is it the same if i define HEAPSIZE=2048 symbol in GNU linker Symbols? 

    My file .lds hass the following code.

    .heap : {
    __heap_start__ = .;
    KEEP(*(.heap))
    __heap_end__ = .;
    __HeapLimit = __heap_end__;
    end = __heap_end__;
    _end = end;
    __end = end;
    } > REGION_HEAP

    I Also have already 3K of stack size, i'm going to increase at 4k

    Can you tell me something more about DFSR register ? because i can't find any reference

    to that in the microcontroller datasheet. 

    Thanks.

    Regards,

    Alberto

  • Hi,

      Sorry, my knowledge in GCC is limited. I find these webpages and hope they are helpful. You can also so some google search on how to allocate heap size for gcc. 

    https://gcc.gnu.org/onlinedocs/gcc-6.1.0/gnat_ugn/Setting-Heap-Size-from-gnatlink.html

    https://software-dl.ti.com/codegen/docs/tiarmclang/compiler_tools_user_guide/compiler_manual/linker_description/04_linker_options/basic-options.html#stdz0752477

    Can you tell me something more about DFSR register ? because i can't find any reference

    Where did you find DFSR? I want to make sure we are talking about the same thing. There is not really a DFSR (Data Fault Status Register) per se for Cortex-M4F processor. As you can see as described in the datasheet, it is simply FAULTSTAT register which can be further categorized as MFAULTSTAT, BFAULTSTAT or UFAULTSTAT. There is no description for DFSR in the datasheet. I have seen DFSR and IFSR (Instruction Fault Status Register) for a different Arm processor such as Cortex-R4/R5 but it is irrelevant here. If you want to learn DFSR which I think is irrelevant here, I have the description below just for reference. Or you can go to the Arm website and search for it. 

      In my earlier reply, I referred you to the app note that diagnose fault exceptions. https://www.ti.com/lit/pdf/spma043. Did you have a chance to go through it? 

  • Hi

    according to the following piece of document that you have sent to me:

    I saw that 

    0xE000ED30 DFSR RW 0x00000000 Debug Fault Status Register

    in the header file of the microntroller i have this:

    #define NVIC_DEBUG_STAT_R       (*((volatile uint32_t *)0xE000ED30))

    But i can't find it in the datasheet.

    Best regards

    Alberto

  • Ok. You meant 'Debug' Fault Status Register, not 'Data' Fault Status Register. This register is not mentioned in our datasheet. However, looking at the Arm Cortex-M3 TRM, there is indeed this register. You can find the details on Arm website https://developer.arm.com/documentation/ddi0419/c/Debug-Architecture/ARMv6-M-Debug/Debug-register-support-in-the-SCS/Debug-Fault-Status-Register--DFSR.

    What type of application are you creating where you are suspecting the fault is related to Debug? Normally, faults happen during runtime. I have not seen faults due to debug unless you are creating some unique application making use the monitor debug which I have no experience with. 

  • i'm working on a class c firmware for  gas boiler management, i'm not suspecting the fault is related to debug .

    i'm triyng to undestand why i have this kind of unmotivated hard fault. 

  • Hi, after checking the debug fault status register i find out that when i have the hard fault with DBG bit set to 1 i also have the BKPT bit set. i still can't feagure out how is possible to have a BKPT instruction while not running in debug.

    Do you have any information/hint in this?

    Thanks.

  • Hi,

      If you have a BKPT bit set, then I think somewhere in your code has the instruction to assert breakpoint to the processor. You might want to search for such line of code. Below is only an example where in a C code, it has a inline assembly instruction to breakpoint the processor. If you wrote your entire code then you would know where you inserted the bkpt instruction. But if you collaborate with others to develop the firmware then you can do some search for bkpt instruction in your project. If there is no such occurrence in your project then I really don't know what caused the BKPT bit to set. You can write a simple code to experiment with BKPT instruction to get a feel for using it.  

    if (g_ui32Tick1ms <= EXPECTED_CPU_FREQUENCY_MAX && g_ui32Tick1ms >= EXPECTED_CPU_FREQUENCY_MIN) {
    MAP_GPIOPinWrite(GPIO_PORTF_BASE, RED_LED, 0);
    MAP_GPIOPinWrite(GPIO_PORTF_BASE, GREEN_LED, GREEN_LED);

    } else {

    MAP_GPIOPinWrite(GPIO_PORTF_BASE, GREEN_LED, 0);
    MAP_GPIOPinWrite(GPIO_PORTF_BASE, RED_LED, RED_LED);
    asm(" bkpt #1");
    }

    Refer to Arm website about BKPT instruction. 

    https://developer.arm.com/documentation/dui0473/m/arm-and-thumb-instructions/bkpt

  • hi,

    I've searched in all my source code, no reference about bkpt instruction, instead watching the disassembly file :

    _exit():
    00034564: F04F31FF mov.w r1, #-1
    00034568: F000B800 b.w _kill
    _kill():
    0003456c: B530 push {r4, r5, r14}
    0003456e: B083 sub r13, #0xc
    00034570: 460D mov r5, r1
    00034572: 9101 str r1, [r13, #4]
    00034574: F7FFFFCC bl _has_ext_exit_extended
    00034578: 2800 cmp r0, #0
    0003457a: BF14 ite ne
    0003457c: 2420 movne r4, #0x20
    0003457e: 2418 moveq r4, #0x18
    00034580: 2D06 cmp r5, #6
    00034582: BF0C ite eq
    00034584: 4B05 ldreq r3, [pc, #0x14]
    00034586: 4B06 ldrne r3, [pc, #0x18]
    00034588: 9300 str r3, [r13]
    0003458a: 466D mov r5, r13
    0003458c: 4620 mov r0, r4
    0003458e: 4629 mov r1, r5
    00034590: BEAB bkpt #0xab
    00034592: 4604 mov r4, r0
    00034594: 4620 mov r0, r4
    00034596: B003 add r13, #0xc
    00034598: BD30 pop {r4, r5, pc}
    0003459a: BF00 nop
    0003459c: 0023 movs r3, r4
    0003459e: 0002 movs r2, r0
    000345a0: 0026 movs r6, r4
    000345a2: 0002 movs r2, r0

    i found these but i'm unable to understand where this is generated, it seems to pass these instructions before the hard fault..

  • If you look at your disassembly, it seems like it is coming from _exit(). You are using GCC compiler and I think this is part of the GCC RTS library. As to how and why _exit() is landed in your project, I don't know for sure and you need to investigate. But I can share one clue. Try this very very simple program and you most likely will end up in _exit() and this is a normal program termination behavior after the main() is exited. Normally for a microcontroller firmware, the main() function should never be exited unless you intend it to. See if this the reason for your problem.

    int
    main(void)
    {

    return 0;

    }

    When I run this program on on CCS using TI Arm compiler, it will end in a abort function which is doing nothing but just spin in a loop. GCC may have added extra stuffs such as to assert BKPT so that the debugger can diagnose. 

    #include <stdlib.h>
    #include <_lock.h>
    #include <pprof.h>
    
    #ifdef __TI_RTS_BUILD
    /*---------------------------------------------------------------------------*/
    /* __TI_default_exit indicates that the default TI exit routine is being     */
    /* used.  The linker makes assumptions about what exit does when this symbol */
    /* is seen. This symbols should NOT be defined if a customized exit routine  */
    /* is used.                                                                  */
    /*---------------------------------------------------------------------------*/
    __asm("__TI_default_exit .set 1");
    #endif
    
    void                     (*__TI_cleanup_ptr)(void) = NULL;
    void   _DATA_ACCESS      (*__TI_dtors_ptr)(int)    = NULL;
    
    typedef void (*PTRFUNC)();
    int __TI_enable_exit_profile_output = 1;
    
    extern void abort(void);
    
    /****************************************************************************/
    /* EXIT() - NORMAL PROGRAM TERMINATION.                                     */
    /****************************************************************************/
    extern void exit(int status)
    {
       /*----------------------------------------------------------------------*/
       /* Output profile info if we have a valid path profile output handler   */
       /*----------------------------------------------------------------------*/
       if (__TI_enable_exit_profile_output &&
           _symval(&__TI_pprof_out_hndl) != (unsigned)-1)
       {
           PTRFUNC ppfunc = (PTRFUNC)(_symval(&__TI_pprof_out_hndl));
           (ppfunc)();
       }
    
       /*-------------------------------------------------------------------*/
       /* MUST LOCK WHEN ACCESSING GLOBALS, like __TI_dtors_ptr,            */
       /* __TI_cleanup_ptr                                                  */
       /*-------------------------------------------------------------------*/
       _lock();
    
       /*-------------------------------------------------------------------*/
       /* BOTH ATEXIT FUNCTIONS AND STATIC OBJECT DESTRUCTORS ARE           */
       /* REGISTERED IN A LINK LIST TO BE PROCESSED BY THE FUNCTION POINTED */
       /* TO BY __TI_dtors_ptr.  PROCESS THEM NOW.                          */
       /*-------------------------------------------------------------------*/
       if (__TI_dtors_ptr)  (*__TI_dtors_ptr)(status);
    
       /*-------------------------------------------------------------------*/
       /* IF FILES ARE POSSIBLY OPEN, __TI_cleanup_ptr() WILL BE SETUP TO   */
       /* CLOSE THEM.                                                       */
       /*-------------------------------------------------------------------*/
       if (__TI_cleanup_ptr)  (*__TI_cleanup_ptr)();
    
       _unlock();
       abort();
    }


    /****************************************************************************/
    /* ABORT - ABNORMAL PROGRAM TERMINATION.  CURRENTLY JUST HALTS EXECUTION.   */
    /****************************************************************************/
    __attribute__((section(".text:abort")))
    void abort(void)
    {
    #if defined(EMBED_CIO_BP)
       __asm("         .global C$$EXITE");
    #if defined(__32bis__)
       __asm("C$$EXITE:.word 0xDEFED0FE");
    #else
       __asm("	 .align  4");
    #if defined(__big_endian__)
       __asm("C$$EXITE:.half 0xDEFE");
    #else
       __asm("C$$EXITE:.half 0xD0FE");
    #endif /* __big_endian__ */
    #endif /* __32bis__      */
    
    #else  /* !EMBED_CIO_BP */
       __asm("        .global C$$EXIT");
       __asm("C$$EXIT: nop");
    #endif
    
        for (;;);   /* SPINS FOREVER */
    }

  • Hi,

      I have not heard back from you. I hope your problem is resolved. I will close the thread for now. If you have any update, you can write back to this post and the status will change to OPEN again.