Part Number: TMS570LS3137
Tool/software:
Hi all,
I tried a new XDS debug probe for my target (the old one is working correctly)
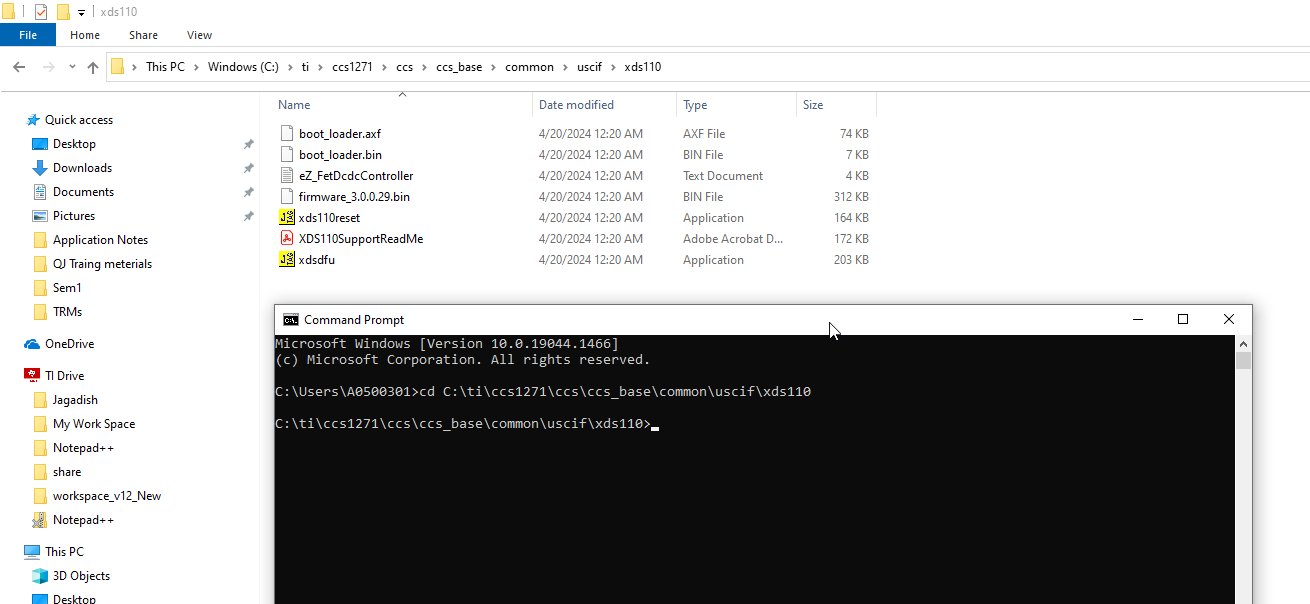
With the same configuration, target and connector, the new probe give me an error
as depicted in the picture attached
Any suggestion?
Thanks
Fabio