This thread has been locked.

If you have a related question, please click the "Ask a related question" button in the top right corner. The newly created question will be automatically linked to this question.

TM4C123GH6PM: TM4C123GH6PM debug with XDS200 and USB100v2

Part Number: TM4C123GH6PM
Other Parts Discussed in Thread: EK-TM4C123GXL, UNIFLASH

Tool/software:

Hi,

I have an EK-TM4C123GXL launchpad includes TM4C123GH6PM and Blackhawk XDS200 Debug Probe and USB 100v2. 

I am trying connect to tm4c123gh6pm with these two debugger but i am failed. I am working at the error but i could not handle it.

first, the error is like that;

The value is '-183' (0xffffff49).
The title is 'SC_ERR_CTL_CBL_BREAK_FAR'.

The explanation is:
The controller has detected a cable break far-from itself.
The user must connect the cable/pod to the target.

my connections are;

blackhawk debugger's TMS---> EK-TM4C123GXL TMS.

blackhawk debugger's TCK--->EK-TM4C123GXL TCK.

blackhawk debugger's TDI--->EK-TM4C123GXL TDI.

blackhawk debugger's TDO--->EK-TM4C123GXL TDO.

blackhawk debugger's nRST--->EK-TM4C123GXL RESET.

blackhawk debugger's GND--->EK-TM4C123GXL GND.

blackhawk debugger's TVD--->EK-TM4C123GXL 3.3V.

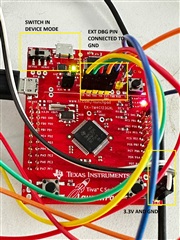
EK-TM4C123GXL EXTDBG--->GND.

supply switch on DEVICE.

I am sure the cable connections and tried both of debuggers. Using CSS 11 and Uniflash 9.1, I tried see the memory and failed. Also tried debug with ccs and failed again. both of programs sens the debuggers. Is there something I've overlooked?

I want to debug this microcontroller( two debuggers (XDS200 and USBv2). can you hep me ? 

Best Regards, Esat.

  • Hi,

      Please follow section 4.5 on this app note https://www.ti.com/lit/pdf/spma075 on how to use an external debug probe for EK-TM4C129GXL. On the power selector switch, you need to select the DEVICE USB. In your picture the power selector switch is on Debug position. 

  • Hi charles,

    Sorry the photo, I forgot the pull DEVICE when taking photo. I tried all combinations of the buttons/pins. Normally I am working on DEVICE mode.

    Best Regards. 

  • If you select power from the DEVICE USB then the power LED will lit. I don't see that in your picture. Your picture is too small and I can't really tell if the LED turns on or not. In CCS, you can do a scan-chain test. See below. 

    Also what JTAG header do you have on the XDS side? is it a Arm 20-pin header or a TI 20-pin cTI?

  • Hi,

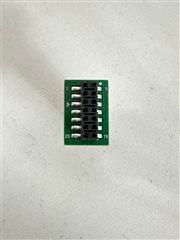
     I have two adaptors and I tried both of them(20 pin-cTI to TI-14 Pin & 20 pin-cTI to ARM 20-pin). I converted with this adaptors the emulators headers.

    I checked the cable connections many times and I am really sure. EXT DGB pin is connected to GND. 5 JTAG pins are(TMS, TCK, TDI, TDO, nRST) connected as they should be. GND and 3.3V are shared. The switch is in DEVICE position. I can't see any problem with the software and drivers. Board voltages are correct.When I tried the "Test Connection", Power Led is always light.

    I also tried it on 2 different boards in case the processor on the board was broken, the result is the same. It does not see the TM4C board at all.

    The adaptors are like that;

    What do you think the problem could be?

  • Hi,

    The value is '-183' (0xffffff49).
    The title is 'SC_ERR_CTL_CBL_BREAK_FAR'.

      Can you use the guidance provide on this link to debug the problem? Go to the section that talks about "Cable Break" as your error is pertaining to. 

    https://software-dl.ti.com/ccs/esd/documents/ccs_debugging_jtag_connectivity_issues.html? 

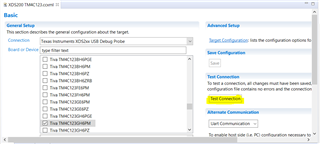
     When you perform the Test Connection, what is the result?

     I will suggest you also try:

      - probe TMS, TDI and TDO.

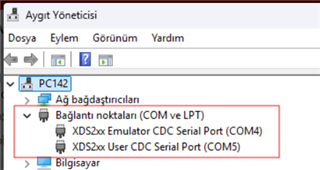
      - Check Device Manager and make sure the debug probe is correctly enumerated

      - Do you have any other boards that already have a standard  Arm JTAG header that you can use your XDS200 to debug. This is to make sure the XDS200 is working properly.

      - Have you used the EK-TM4c123GXL before? I'm not sure if there is any code in it that prevents from JTAG access. Can you try Unlock the device to its factory settings?

     Finally, is there any strong reason why you want to use an external debug probe for debugging EK-TM4C123GXL? The LaunchPad already has an integrated ICDI probe. I think it is well suited for most debugging scenarios. Since the LaunchPad does not have a external JTAG header, it makes it cumbersome to use blue wires to connect between the board and the debug probe as in your approach. 


  • Hi, 

    -->Thank you for your advices, I will review the document you sent.

    -->When I do test connection results text is below.


    -----[Print the reset-command software log-file]-----------------------------

    This utility has selected a 560/2xx-class product.
    This utility will load the program 'xds2xxu.out'.
    The library build date was 'Mar 17 2022'.
    The library build time was '19:20:23'.
    The library package version is '9.7.0.00213'.
    The library component version is '35.35.0.0'.
    The controller does not use a programmable FPGA.

    An error occurred while hard opening the controller.

    -----[An error has occurred and this utility has aborted]--------------------

    This error is generated by TI's USCIF driver or utilities.

    The value is '-183' (0xffffff49).
    The title is 'SC_ERR_CTL_CBL_BREAK_FAR'.

    The explanation is:
    The controller has detected a cable break far-from itself.
    The user must connect the cable/pod to the target.

    [End: Texas Instruments XDS2xx USB Debug Probe_0]

    -->debugger seen like that photo by device manager

    -->Unfortunately, I do not have another processor. By the way, I also tried all these tests with the USB100v2 debugguer.

    -->Then I probed all the pins. No movement (like falling or rising edges) is visible.

    -->I reset the processor to factory settings with its own internal debugger in case of the configuration you mentioned.

    -->Since I thought that pull-up and pull-down conditions were happening on both the debug and processor board sides, I did not make any external pull-up or pull-down.

    -->Unfortunately, as you said, I cannot use the internal debug part. According to the project requirements, I need to connect with an external debug probe, not with the internal debug. I really have to do this.

    I have looked at all these connections and configurations many times but I could not find any errors. Any ideas you give me will be very useful for me.

  • -->Then I probed all the pins. No movement (like falling or rising edges) is visible.

    If there is no activity on TMS, TDI and TDO pins then this is the first thing to debug why. Are you always in reset? Check the reset pin. 

    Why don't you follow section 4.5 Using an External Standalone Debug Probe With EK-TM4C123GXL in the app note to see if you can use one LaunchPad to debug another LaunchPad and probe the same signals (TMS, TDI, TDO). This way you can compare with your XDS200 wire connection to the header. 

    -->Unfortunately, as you said, I cannot use the internal debug part. According to the project requirements, I need to connect with an external debug probe, not with the internal debug. I really have to do this.

    Understand you need to use XDS200 or any external debug probe for your final custom board. However, this does not prevent you from starting software development on the LaunchPad as-is using the integrated ICDI probe.  For you custom board design, you just need to follow the guidance on section 4 as to add a JTAG header so any debug probe that supports Arm header can plug into. 

  • If there is no activity on TMS, TDI and TDO pins then this is the first thing to debug why. Are you always in reset? Check the reset pin. 

    Why don't you follow section 4.5 Using an External Standalone Debug Probe With EK-TM4C123GXL in the app note to see if you can use one LaunchPad to debug another LaunchPad and probe the same signals (TMS, TDI, TDO). This way you can compare with your XDS200 wire connection to the header. 

    I tried to do it as you said using one tm4c123 as debugger and the other tm4c123 as device and it can debug successfully. I connected only 4 JTAG pins (TMS,TCK,TDI,TDO) between the two boards without even sharing the GNDs. The EXT DBG pin on both boards is empty. And I put the switch of the device board to DEVICE and the switch of the debug board to DEBUG. This means that there is no problem with my jtag connections. But the XDS devices I have are also reliable and there are 2 of them. So we are almost sure that it is correct.

    Understand you need to use XDS200 or any external debug probe for your final custom board. However, this does not prevent you from starting software development on the LaunchPad as-is using the integrated ICDI probe.  For you custom board design, you just need to follow the guidance on section 4 as to add a JTAG header so any debug probe that supports Arm header can plug into. 

    Thank you, 

    I want to ask one more thing. There are a few more points I don't understand.
    1) Should the EXT DBG pin be pulled to GND when we use the tm4c card as a programmer or should it be pulled to GND when we program with a debugger?
    2) I researched driver software for XDS200 and XDS100v2. As far as I understand, when I load CCS (v11.2), the debugger driver is also loaded. Is it software-enough for XDSxxx devices to appear in the device manager and in CCS & UniFlash programs?

  • I tried to do it as you said using one tm4c123 as debugger and the other tm4c123 as device and it can debug successfully. I connected only 4 JTAG pins (TMS,TCK,TDI,TDO) between the two boards without even sharing the GNDs.

    Good that it is working. This at least proves that the LaunchPad is working in terms of receiving external debug probe signals. 

    The EXT DBG pin on both boards is empty. And I put the switch of the device board to DEVICE and the switch of the debug board to DEBUG.
    1) Should the EXT DBG pin be pulled to GND when we use the tm4c card as a programmer or should it be pulled to GND when we program with a debugger?

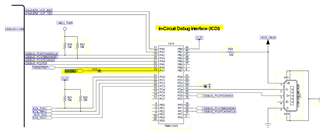
    If you look at the schematic, the EXTDBG is an input to ICDI. You need to tie it to GND so that ICDI is bypassed on your target device so the external XDS200 can take over. 

    2) I researched driver software for XDS200 and XDS100v2. As far as I understand, when I load CCS (v11.2), the debugger driver is also loaded. Is it software-enough for XDSxxx devices to appear in the device manager and in CCS & UniFlash programs?

    In your device manager image, the XDS200 driver is correctly loaded. 

    I suppose the XDS200 has the default Compact TI 20pin connector. Go to https://software-dl.ti.com/ccs/esd/documents/xdsdebugprobes/emu_jtag_connectors.html and look under Pinout section to see the different connectors. 

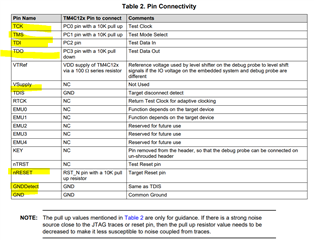
    For cTI 20pin connector, below is what you would have implemented on your board had you chosen to populate a cTI header on your board. Please probe the signals I highlighted in yellow and see if the XDS200 has the correct signals come out on these pins. 

  • Thank You Charles,

    I solved the problem. 

    I said that I tried every combination and checked all the connections. Today I accidentally solved the problem. The situation is as follows;


    In the pin documents, pin number 4 (14 pin TI header) is seen as TDIS and in the document you sent, this pin is specified as GND. In the pinout document of the 14 pin TI connector, pins 8, 10 and 12 are also shown as GND along with number 4. I tried by sharing the GND of the board and the GND of the debugger with these pins. But I can only debug when it is shared with pin number 4. Connecting this pin to GND solved my problem.


    Thank you very much for your patience and help.

    Best Regards