This thread has been locked.

If you have a related question, please click the "Ask a related question" button in the top right corner. The newly created question will be automatically linked to this question.

LP-MSPM0G3519: How to see the display to Trace module in CSC example

Part Number: LP-MSPM0G3519
Other Parts Discussed in Thread: MSPM0G3519

Tool/software:

Hello,

I am debugging the secure boot and want to see the display sent to Trace module.

When enabling Trace Display in CCS, I got this error:
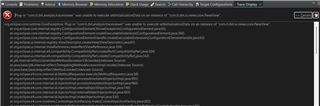
Where can I find some documentation talking about how to use Trace display for this MCU?

Thanks!

Crane

  • Hi Sal,

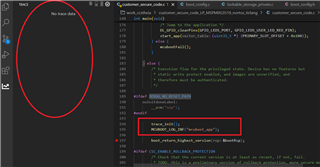
    I installed CCS20 and try to run CSC. I would like to confirm if the area in the left red circle is the Trace display windows as I couldn't verify it on MSPM0G3519 MCU.

    I tried to enable trace but it fails to build the project. I don't find that in SysCfg. And I think MSPM0G3519 doesn't support Trace module. 

    Thanks!

    Crane

  • Hi Crane,

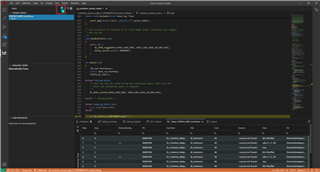
    Sorry for the late response. You should click on the button of the trace mode:

    B.R.

    Sal

  • Hi Sal,

    Thank you for your reply.

    There buttons are only available for clicking after the program is being debugged, right?

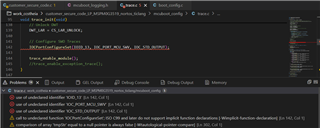
    But I got these compiling errors as in below screenshot after removing the macro EXCLUDE_TRACE to enable trace. 


    I am afraid it is because the Trace module is not added in SysCfg. Then I realize there is no Trace module available to be added there. I don't see it mentioned in the data sheet and thought G3519 doesn't support Trace module, but it looks like you got it right. How did you add the Trace module to the project then?

    Thanks!

    Crane

  • Hi Crane,

    There buttons are only available for clicking after the program is being debugged, right?

    Yes it is.

    But I got these compiling errors as in below screenshot after removing the macro EXCLUDE_TRACE to enable trace. 

    Please keep the orginal pre-definition. I also see the error as we do not support ICO in the M0+ core.

    And enable the trace mode is non-related to this definition.

    B.R.

    Sal

  • Hi Sal,

    Ok. Then it means that the trace module can be enabled in IDE when debugging this MCU, but it won't be able to display any information as this MCU doesn't support it, right?

    Thanks!

    Crane

  • Hi Crane,

    No, it just don't support the trace.c function defined in the example.

    As you can see what I showed here, the trace mode is enabled and works: [I run the sample project in G3519, please take a look in the picture carefully]

    Sorry for the late response. You should click on the button of the trace mode:

    It show the trace mode in the right corner. you can manually click on the button where I highlight with read circle to enable it.

    Then after you stop at some breakpoint, it will show the tracking assembly code in the table.

    But I got these compiling errors as in below screenshot after removing the macro EXCLUDE_TRACE to enable trace. 

    This is non-related to the trace mode. This is the appliaction code level function, which have some issues, I'll report in to internal team to fix it.

    B.R.

    Sal

  • Hi Sal,

    Ok, you mean even if the EXCLUDE_TRACE is kept as the original, the trace module in IDE would still display some information. The trace display in IDE is not related to the trace module in MCU, right?

    My understanding is that, in this case, the information printed through MCUBOOT_LOG_INF() wouldn't be shown in Trace display, right? For the MCUs that supports Trace module, the information printed through MCUBOOT_LOG_INF() would be shown there, right?

    Thanks!

    Crane

  • Hi Crane,

    Yes, The IDE based trace module is always active, which related MTB function.

    MCUBOOT_LOG_INF() won't show information in the trace module, it is appliacation level code.

    B.R.

    Sal

  • Hi Sal,

    Ok, IDE based trace module is related MTB function. As MTB is available in G3519 MCU, IDE based trace module should be able to display some information.

    MCUBOOT_LOG_INF() is application level. But my understanding is that it is related to the hardware Trace module, which is not available in G3519 MCU. Is this right? So it won't work for G3519, right?

    Thanks!

    Crane

  • Hi Crane,

    I think it is application level while also related to hardware feature. I haven't check the source code level of this demo. One thing is that it manual add the ICO function in the trace.c code, but Cortex M0+ doesn't support SWO features, so this trace.c will results in the build error.

    I will create the internal thread to track and our SDK will take a fix in the following release.

    I sugges you use the IDE based trace mode for your debug activity.

    B.R.

    Sal

  • Hi Sal,

    Now I have a clear picture about the IDE trace mode, the hardware trace module and how they are related to the application level ICO functions and know what I can and can't use to debug the secure boot with G3519 MCU.

    Thank you so much for clarifying everything!

    Regards,

    Crane