Part Number: *****>
This thread has been locked.
If you have a related question, please click the "Ask a related question" button in the top right corner. The newly created question will be automatically linked to this question.
Hello Munan,
As you may already know, the way we can see the HW breakpoints is in the breakpoints tab in the debug section and clearing them from there. However, I have seen an issue similar where the breakpoints issue was resolved by uninstalling and reinstalling the CCS. Can you verify if this works for your scenario?
Also, based on the TRM for MSPM0-C family, it does state in section 3.2 that the number of HW breakpoints, specifically for C, is two hardware breakpoints while the other 4 HW breakpoint references are more of a generalization of the limitations of MSPM0 MCUs.
Regards, Jojo
Hey Jojo,
So the issue is that you can see the breakpoints that the user has set in code within CCS, but the ones that are set by CCS to enable things like CIO and the breakpoint at program exit are not visible to the user. So on a device like the MSPM0C1104 where there are only 2 hardware breakpoints, this is a pretty big limitation since all or half the breakpoints can be consumed and you wouldn't even know.
Also, the halt at main can take up a breakpoint which becomes an issue if you have 2 breakpoints set in your code and then the program won't halt at main because all the breakpoints will have been consumed. Having a little more visibility into which breakpoints are consumed by system functions could help.
Finally, my last point is for the number of hardware breakpoints we do not specify this in the MSPM0C1104 datasheet anywhere and we should include this if it is different than the number quoted in the TRM.
Munan
Hello Munan,
Thank you for that information. Let me forward this to the CCS team to verify if, aside the breakpoint section, there is another section or method to know the total hardware breakpoints set at a time for accurate visibility purposes.
Regarding your last point, I agree that it should be clearer in the TRM regarding the other references but looking at the other datasheets of different MSPM0 devices, it seems hardware breakpoints are not included entirely. I will submit a doc feedback regarding the C family TRM.
Regards, Jojo
Having a little more visibility into which breakpoints are consumed by system functions could help.
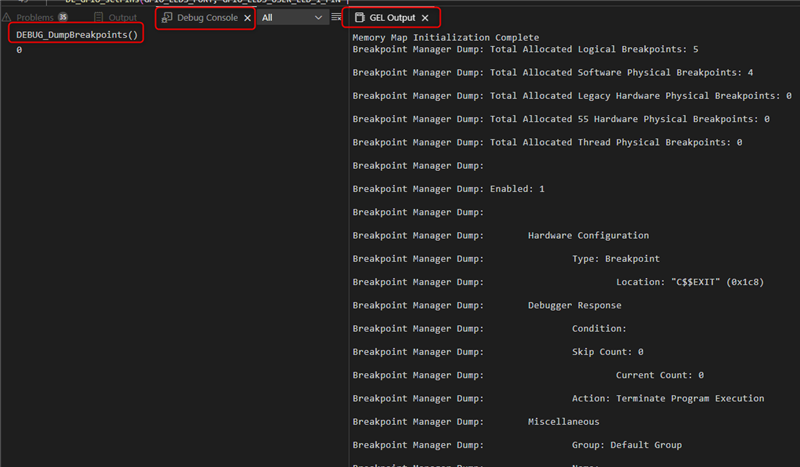
In the Debug Console view, can you run the below command:
DEBUG_DumpBreakpoints()
And check the GEL_Output view, check the output to see the status of breakpoint usage:
Please copy and past the output to a text file and attach the file to this thread.
Thanks
ki
CCS Version:
Version: 20.2.0.12__1.8.0
Default VS Code API: 1.96.0
VS Code Compatibility
Thanks. I found some strange behavior. It is likely what you are experiencing also.
Can you remove all breakpoints and then terminate the debug session. Then start a new one. Then run the "Debug_DumpBreakpoints() in the Debug Console BEFORE you set any breakpoints and see if you see any output. If you do, then set some breakpoints and see if you still see output.