This thread has been locked.

If you have a related question, please click the "Ask a related question" button in the top right corner. The newly created question will be automatically linked to this question.

MSPM0G3519: Unable to enter into any ISR with newly sourced MCU's but firmware works without fault on Launchpad

Part Number: MSPM0G3519
Other Parts Discussed in Thread: UNIFLASH, SEGGER

Tool/software:

Hi Support,

The strange behavior that we are experiencing on our new hardware is with the interrupt controller not generating any interrupts. By this I mean we never get into the ISR. But the same code works on the MSPM0G3519 Launchpad without fault. The interrupts I have tested are ADC, timer and SYS-Tick.
To isolate the problem and simplify the code base I went back to Ti's Code Composer and generated some basic examples using the SDK, namely
  • adc_to_uart
  • sysctl_mclk_syspll
  • Systick_periodic timer
I then tested each example on the launchpad successfully before loading it on to our new hardware. Each example running on our hardware wasn't able to get into the ISR.
We then decided to transfer the Launchpad MCU over to our new hardware to see if it is an issue with either our design or the newly purchased MCU. The transfer was successful with the sample applications and our own application working and getting into the relevant ISR when triggered.
The question we have, Is there anything special with a freshly sourced MCU that we need to be aware of?
The marking on the MCUs are as follows
  • The launchpad MCU has the following identification:
    M0G3519S
    X46AVGCW
  • While we built our own hardware with the following MCU identification
    MOG3519S
    X51C78JW
Any information you can provide will be of great help.
Regards,
Jes
  • Could you please try to solder issue MCU to Launchpad, try to get the ISR test result?

  • We have done this with the same result, the firmware doesn't enter into the ISR.

    Below is some information from the issue MCU's factory region.

    TraceID 0x4E6A8
    ManufacturerCode 0x17
    PartNumber 0xBBA9
    Version 0x0
    TemperatureVoltage 0x31C
    UserIDPart 0x1508
    UserIDVariant 0x16

  • Could you please try this demo code on the issue M0? in SDK:

    C:\ti\mspm0_sdk_2_05_00_05\examples\nortos\LP_MSPM0G3519\driverlib\timx_timer_mode_periodic_sleep

    Or the same one I uploaded here:

    timx_timer_mode_periodic_sleep_LP_MSPM0G3519_nortos_ticlang.zip

    It will enter Timer interrupt.

    MCU is different only in batches.

    Also, since your test is based on MSPM0 SDK, if there is any modification, please let me know.

    Also, please let me know if there is CCS/SDK environment difference between test on Launchpad and your own PCB.

  • I connected our hardware(Id 0006) to CCS studio via the launchpad that has a XDS110 probe on it and executed the original simple SysTick example. This was able to get into the ISR. I then went back to our development environment and executed the same simple SysTick example and it also worked.

    I then tried  executing our Test Harness project on our hardware(Id 0006)  where the simple SysTick example had just worked and it failed to load. The binary size for the Test Harness application is 55 Kbytes. The IDE loads up about 40KBytes then hangs.

    But on a separate unit of our hardware(Id 0008) where we preformed the MCU swap from the launchpad we are able to download and execute the Test Harness application in the same environment. Our development environment is Rowley Cross Studio ARM 5.2.0 with GNU compiler 14.2.1. We used a Cross Connect as the debugger probe.

    This does suggest that CCS, configures special sections of memory of the MCU for it to download and execute firmware. I have found a *.gel file  in the directory C:\ti\ccs2010\ccs\ccs_base\emulation\gel that looks like it sets up these special regions but I can't spot where in the file the settings that is causing this issue.

    Is there a way I can read all sections of memory, even the special regions?

    Using CCS studio 20.2.0

    MSPM0 SDK 2_5_1_0

    SYS_CONFIG 1.24.0

  • I connected our hardware(Id 0006) to CCS studio via the launchpad that has a XDS110 probe on it and executed the original simple SysTick example. This was able to get into the ISR. I then went back to our development environment and executed the same simple SysTick example and it also worked.

    It seems interrupt issue is resolved and this may caused by hardware.

    I then tried  executing our Test Harness project on our hardware(Id 0006)  where the simple SysTick example had just worked and it failed to load. The binary size for the Test Harness application is 55 Kbytes. The IDE loads up about 40KBytes then hangs.

    Try low speed SWD.

    Try a shorter SWD cable.

    Check Id 0006 SWD signal waveform, try to confirm whether there is lots of noise on SWD.

    Before next program, please try to run factory reset to get device recovered.

    Our development environment is Rowley Cross Studio ARM 5.2.0 with GNU compiler 14.2.1. We used a Cross Connect as the debugger probe.

    I don't have any experience about these tool chains.

    Is there a way I can read all sections of memory, even the special regions?

    You can try to use Uniflash from ti.com to download all memory to txt file, using XDS110.

    Regards,

    Helic

  • Hi Helic,

    This is not a solution for us especially in a production environment where currently we need to program our hardware twice in order for it to work.

    After some more investigation in order to get our test harness working correctly for a freshly source MCU or performing a factory reset and to overcome issues with loading our firmware and having interrupts working either on the launchpad or our hardware we need to load "out-of-box" example from the SDK first. 

    This suggest that Code Composer Studio during loading sets a section of memory correctly for it to work. Can you please identify all the special regions of memory for this processor and any documentation available to describe these sections. I am only aware of the NONMAIN region from 0x41C00000 to 0x41C00020

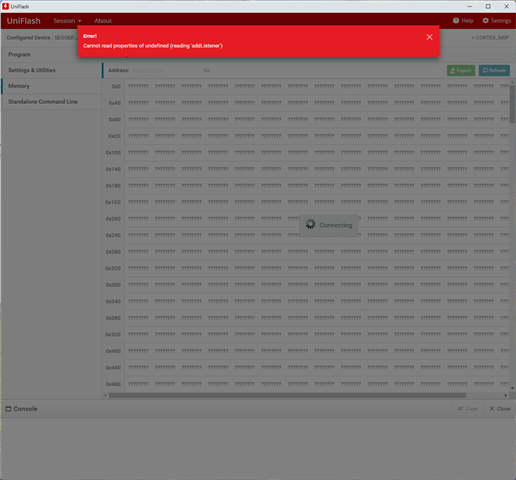
    I also tried to take a memory dump of the MCU and save it to a file using the UniFlash tool, but it keeps on crashing as shown in the attachment.

    This is now becoming a critical issue for the company

    Regards,

    Jes

  • I also tried to take a memory dump of the MCU and save it to a file using the UniFlash tool, but it keeps on crashing as shown in the attachment.

    Try twice or 3 time to see if there is any error.

    It quite common that first read using Uniflash not working.

    After some more investigation in order to get our test harness working correctly for a freshly source MCU or performing a factory reset and to overcome issues with loading our firmware and having interrupts working either on the launchpad or our hardware we need to load "out-of-box" example from the SDK first. 

    Try to program and code from SDK before your own firmware will help resolve these issue?

    This is abnormal.

    What's the programming tool you are using in your factory?

    This does suggest that CCS, configures special sections of memory of the MCU for it to download and execute firmware. I have found a *.gel file  in the directory C:\ti\ccs2010\ccs\ccs_base\emulation\gel that looks like it sets up these special regions but I can't spot where in the file the settings that is causing this issue.

    Could you please tell me which steps in these gel file?

    Maybe, there is a function here will influence the program step, but that's depending on whether you enable it or not(disable in default)

    And debugger will also try to reset MSPM0 before program:

  • Helic Chi,

    What's the programming tool you are using in your factory?

    We will BSL the image to the MCU in the factory. This process is still to be verified.

    I managed to take memory dumps of working and non-working MCU running our test harness application successfully using a SEGGER tool. I see that the PPB region 0xE0000000 size="0x100000" is different in areas between a working and non-working MCU. Can this be the source of the problem. The vector-table offset is loaded in this region.

    As mentioned in a previous post our development environment is Rowley Cross Studio ARM 5.2.0 with GNU compiler 14.2.1. We used a Cross Connect as the debugger probe. What I have found, is that if I use SEGGER j-Link connected to the same IDE Rowley Cross Studio, that the Test Harness on a freshly source MCU will execute correctly. I have spoken to Rowley about the issue, and they believe it has nothing to do with the debugger probe; they did say that TI supplies them with a, ". FLM" file which is used to do the flash programming. Do you have any additional information about this file? The other information I found in the past week is that we are able to program the 80pin variant with no issues in our development environment.

    Could you please tell me which steps in these gel file?

    Maybe, there is a function here will influence the program step, but that's depending on whether you enable it or not(disable in default)

    I was hoping you can provide me with that answer. Using the CCS tool where is the configuration to program the PPB region?

    Regards,

    Jes

  • I was hoping you can provide me with that answer. Using the CCS tool where is the configuration to program the PPB region?

    https://www.ti.com/lit/an/slaaeo5/slaaeo5.pdf

    1.2 Behaviors With the MSPM0 in a Blank/Low-Power State

    I am not sure whether your issue is caused by this low power or blank chip status.

    Could you please try the description in section 1.2?