AM2434: Understanding AM2434 performance

Part Number: AM2434
Other Parts Discussed in Thread: TMDS243EVM, AM2612, , LP-AM261, AM6442, SYSCONFIG, MATHLIB

Hi support team,

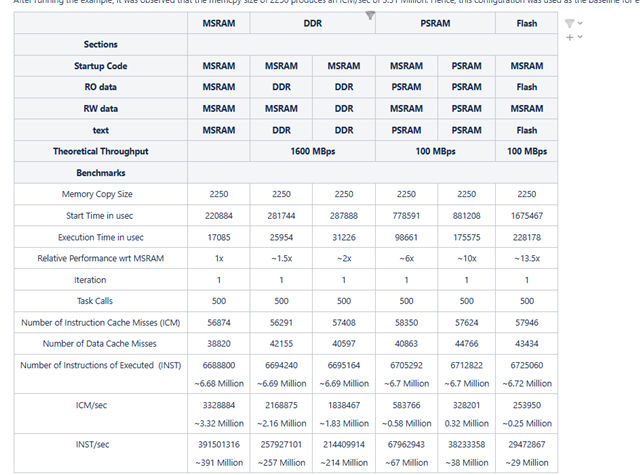
I am evaluating both AM2612 and AM2434. With the same code used for benchmarking, and placing the code, data and stack in the main memory (OCSRAM or MSRAM), with cache enabled, MPU correctly configured, and the clocks as provided in the example demos (R5f @500MHz on AM2612 and 800MHZ on AM2434 on TMDS243EVM board), I am experiencing similar results on both targets, while I expected a better performance with AM2434 which has a higher clock speed for R5F core.

I am trying to find the differences between the two setups: I have the same code, same compiler, same compiler options (-O2), same MPU configuration, different R5 clocks, and the only factor I could think is the MSRAM/OCSRAM clock frequency.

I found in the AM2612 reference manual that the OCSRAM is clocked at 200MHz (see below), but I can not find any information about the MSRAM in AM2434 (as refered in this post: https://e2e.ti.com/support/microcontrollers/arm-based-microcontrollers-group/arm-based-microcontrollers/f/arm-based-microcontrollers-forum/1326676/mcu-plus-sdk-am243x-sram-clock?tisearch=e2e-sitesearch&keymatch=am2434%2525252520sram%2525252520clock):

image.png

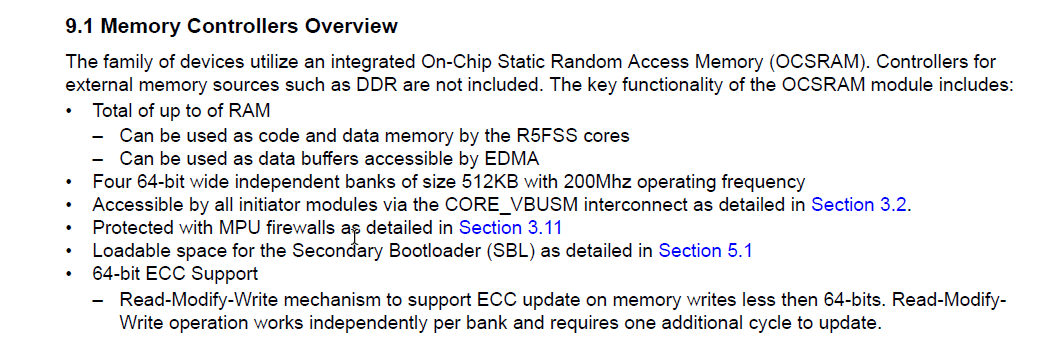
I am just trying to figure out what leads to this difference, so if you could at least give me the MSRAM frequency in AM2434, that would be great. In my project, the AM24x_GP_EVM.gel script is used to initialize the CPU clocks for the board (with DDR).

Best regards


  • Hello Gael,

    Can you please post screenshots of the benchmark results? Thanks!

    Regards,

    Stan

  • Hi Stanislav,

    I don't have a screenshot with my measurements, but I can give the average execution time from my program on both targets:

    - LP-AM261 (R5f monocore @ 500MHz, -O2, code/data/stack in OCRAM, OCRAM bus width and speed: 64 bits, 200MHz): 945.6us

    - TMDS243EVM (R5f monocore @ 800MHz, -O2, code/data in MSRAM, stack in TCMA; MSRAM bus width and speed: ?): 1132.9us

    Can you share some information about the MSRAM on the AM2434, at least clock speed and bus width (64 or 32 bits)?

    Thanks,

    Gael

  • Gael,

    I will need to do some more checks but looks like AM243x MSRAM is running at 250 MHz with bus with 64 bits.

    What is the benchmark you are running?

    Thanks,

    Stan

  • Stanislav,

    If it runs at 250MHz, then I need to dig deeper to understand if the SDK example SW from where I started (it was the ddr ecc example from the drivers folder), configures correctly all the clocks.

    In the TRM, I did not find more information beyond the MAIN_PLL0-HSDIV0 clock output being set at 500MHz, but it is not indicated anywhere which divider is applied to clock the MSRAM banks. If you could confirm the 250MHz, it would be great, thanks.

    The benchmark code I am running is a private application from my company.

    Best regards,

    Gael

  • Hello Gael,

    Would you please open the Sysconfig / Clock Tree Tool for the AM6442 (should be valid also for AM243x) and check the clock diagram ?

    I will follow-up shortly with more details. 

    Thanks

    Best Regards

    Anastas Yordanov

  • Hello Gael,

    Here is an extract of the diagram from the online available Sysconfig/Clock Tree Tool - https://dev.ti.com/sysconfig

    for the AM6442: 


    The divider_219_2 is a SoC level integrated fixed (non-programmable) "/2" divider. Such clock frequency division to functional clock VCLK input applies to all 8x256KB instances: MSRAM_256K0 - MSRAM_256K7.

    So I confirm - MAIN_SYSCLK0_freq / 2 = 250 MHz is the used MSRAM interface clock. 

    Looking forward to your feedback !

    Thanks

    Best Regards

     Anastas Yordanov

  • Hi Anastas,

    Thanks for your inputs.

    Using the sysconfig online tool and the different sub-tools, I checked the internal configuration on the AM24x and compared the different dividers and PLL HSDIV configurations to try to understand how I can have the same performance measured on LP-AM261 at 500MHz and TMDS243EVM at 800MHz, when all my code is run from internal RAM.

    I checked the R5f registers on AM2434 against the configuration provided by the sysconfig tool for AM6442 which is similar to AM2434, especially PLL0_HSDIV0 for MSRAM, and PLL14_HSDIV0 for R5f core clock (800MHz). I checked again that the MPU region for the whole MSRAM was configured as "Cached", I checked the System control register that the cache, I-cache and D-cache are enabled, and I still don't understand why I get such results.

    Do you have a lead on what I could check that I may have missed?

    Do you have any software that has been run on AM261 from internal memory, and on AM2434 from internal memory, to compare the performance with a software of yours? I checked the SDK online under the benchmarks, but I could not find any identical SW with comparable measurements that could give me some comparison.

    I also checked the DDR configuration (for my benchmark which has code only running from DDR), and I checked that the GEL script is correctly configured. I checks the PLL12_HSDIV0 which is set at 400MHz and for this point I have a question: in the GEL scripts, it is clearly written that we want to configure the DDR of TMDS243EVM at 800MHz clock, but the PLL frequency is set to 400MHz. In the reference manual, I was not able to find information about anything doubling the DDR clock. I was thinking that if we wanted to have a DDR clock at 800MHz, that we would need a PLL 12 HSDIV0 output set at 800MHz.

    Could you explain this point?

    Best regards

    Gael

  • Hi,

    Just wanted to chime in. I recall that if a benchmark code is small enough to fit the cache, it will measure the pure CPU/cache performance. This still doesn't explain the results though.

    Best,

    Stan

  • Hi,

    Actually, the code of my benchmark application is small enough to fit in the internal RAM of AM2612 and AM2434 (not the cache). But as you say, I am focusing only on this scenario (not involving the DDR of AM2434) just to be sure the pure performance is better on AM2434. As I have 200MHz clock for MSRAM on AM2612 side with 500MHz R5, and 250MHz clock for MSRAM on AM2434 with 800MHz R5, I was expecting a better performance on AM2434 but I don't observe that. That is why I am interested if you have any piece of software that would have been executed on those processors with comparable measures.

    I also added in my code cache enabling/disabling just to be sure the MPU attributes and caches are enabled, and I confirm that the caches are enabled and MPU is configured correctly for the MSRAM to be cached.

    By the way, if that is of interest, on AM2612 as well as AM2434, when code is executed from MSRAM/OCRAM, the application average execution time is 40% better with cache enabled.

    Best regards,

    Gael

  • Hi Gael,

    You can refer to benchmarking code in MCU+ SDK here:

    https://dev.ti.com/tirex/explore/node?isTheia=false&node=A__AD2nw6Uu4txAz2eqZdShBg__com.ti.MCU_PLUS_SDK_AM243X__AROnekL__LATEST

    And here for AM621x: 

    https://dev.ti.com/tirex/explore/node?isTheia=false&node=A__AD2nw6Uu4txAz2eqZdShBg__MCU-PLUS-SDK-AM261X__ZKtBu0R__LATEST

    Please note that the results are normalized per MHz.

    Also I got some feedback from one of our experts:

    Basically if the R5 is operating out of its own TCM you would expect near single cycle access and optimal performance. If it is going off to main OCSRAM or the other R5 TCM then there will be some access latency which could influence the result

    Thanks,

    Stan

  • Hi Stanislav,

    I looked into the benchmarks in details and there are coremark and drysthone benchmarks that could be compared on both targets, indeed.

    In both benchmarks, code and bss are placed in MSRAM/OCSRAM, and data is placed in TCM, so that compares with my own application benchmark setup.

    On AM2434, the SDK page shows the following numbers, but I think the "usertime in sec" is wrong, since it is computed in the code as "USER cycle count" divided by cpuClockRate which is 800MHz (as shown on the screenshot below). So with 144641654 it should be 0,1808 seconds (instead of 0.723208), right?

    I also took the drysthone example as is, without modifying anything, from SDK "motor_control_sdk_am243x_11_00_00_06", and ran it on the TMDS243EVM board. Here are the results:

    I followed the EVM setup page so I'm sure the SBL null is flashed, and the BOOT pins are set as per the SDK EVM setup page.

    Does this make you think of anything that could be wrong either in my setup, in the clocks configuration, the SDK...?

    Regards,

    Gael

  • Hi Gael,

    I will need some more time to get back to you.

    Thanks,

    Stan 

  • Hi Stan,

    Ok, no problem.

    Gael

  • Hi Gael,

    I will need an hour or two

  • Hi Stan, no problem.

    Thanks

    Gael

  • Hi Stan,

    I realized that by default CCS THEIA uses "Debug" instead of "Release" build configuration...

    I've set the drysthone example in Release configuration and I got those results:

    I don't know what are the differences between debug and release configurations, in terms of debug functions for logs etc... but this result is close to what is published on the SDK website (except "usertime in secs" and "Microseconds for one run").

    I also changed the build configuration from "Debug" to "Release" in my own benchmark application project, and I still have the same results (because the code being measured doesn't contain any call to any function from the SDK that may hide functions called in Debug configuration). So I still don't understand the close performance on both targets. I also checked the datasheets, and the AM2612 has less I-cache and D-cache (16KB each) than AM2434 (32KB each) which should provide even more performance than with the core speed.

    Regards,

    Gael

  • Hi Gael, 

    Sorry for the late reply, I was out of office for 2 days.

    So with 144641654 it should be 0,1808 seconds (instead of 0.723208), right?

    I was wondering too about 0.723208. I've opened the original Dhrystone benchmark code in GitHub and I found there that this value is derived by dividing by number-of-runs that is 2000 by default. 0.723208 is exact div by 2 values not accounting zeroes in the formula. 

    So I still don't understand the close performance on both targets

    Sorry if you already told that but do you mean you are are getting similar results in your own benchmarking code or both - yours and Dhrystone too?

    Regards,

    Stan

  • Stan, Anil,
    I think that Gael refers to his own proprietary benchmarks (as Dhrystone normalizes the results to MIPS/Mhz so you might not see that much differences).

    For his benchmarks on one R5F all code, data and stack are placed in OCRAM or MSRAM. No external memory used.
    I assume same src code and compilation options are being used.
    AM243x performance should be significantly higher than AM261x because:

                    AM243x:                                            AM261x:

                    32kB cache                                      16kB cache

                    800Mhz CPU clk                             500MHz CPU clk

                    250Mhz clocked RAM                  200Mhz clocked RAM


    May  be you could agree to re-run some of the MCU SDK 11.01.xx benchmarks on both platform to compare results?
    For example the Mathlib benchmarks seem to use the same code base:
    https://dev.ti.com/tirex/explore/content/mcu_plus_sdk_am243x_11_01_00_19/docs/api_guide_am243x/EXAMPLES_MATHLIB_BENCHMARK.html
    https://dev.ti.com/tirex/explore/content/mcu_plus_sdk_am261x_11_01_00_19/docs/api_guide_am261x/EXAMPLES_MATHLIB_BENCHMARK.html 

    Thanks in advance,
    Anthony

  • Hello Anthony,

    I can update the status by tomorrow .

    Regards,

    Anil. 

  • Hi. (I was out of office too)

    Sorry if you already told that but do you mean you are are getting similar results in your own benchmarking code or both - yours and Dhrystone too?

    Regards,

    With my benchmarking code on both target I have similar average execution time, but I expected it to be less on AM2434 than on AM261. With the Drysthone, I ran only on AM2434, and I confirmed it gives the same DMIPS/MHz than on AM261, which means the drysthone average execution time lasts less on AM2434 than on AM261 because it runs at 800MHz instead of 500MHz on AM261.

    About the benchmarks rerun: I would focus on a benchmark code that is bigger than Drysthone code size. In my own application benchmark, code is about 1MB and I think only of this as a difference between the drysthone benchmark and my application benchmark. If the code size is small enough, maybe it fits in cache and dryshtone measured performance only reflects this specific case where code is mainly run from cache. I am curious about how one of your application bigger in size would affect the performance.

    Regards,

    Gael

  • Hi Gael,

    When performing benchmarks, it is critical to use the Release build configuration rather than Debug build.

    This can significantly affect your measured performance.

    Debug Build Characteristics:
    - Compiler optimization disabled (typically -O0 flag)
    - Debug symbols included, increasing code size
    - Additional runtime checks and assertions enabled
    - Larger code footprint leads to more cache misses

    Release Build Characteristics:
    - Compiler optimization enabled
    - Smaller and faster generated code
    - Dead code elimination reduces code size
    - Better cache utilization due to compact code

    Memory Latencies : 

    The 63.75 ns latency figure is measured specifically for AM64x/AM243x MSRAM from our application note SPRACV1B. We do not have equivalent published latency measurements for AM261x OCSRAM in the benchmark document. 

    https://www.ti.com/lit/an/spracv1b/spracv1b.pdf?ts=1773221759391&ref_url=https%253A%252F%252Fwww.google.com%252F

    AM243x: 51 cycles memory latency (63.75 ns at 800 MHz)
    AM261x: 24 cycles memory latency (48 ns at 500 MHz) This data taken from internal Team.

    This shows AM261x has lower memory latency in both cycles and absolute time.

    DHRYSTONE ANALYSIS : 

    Your measurements show: 
    - AM243x: 1.96 MIPS/MHz at 800 MHz

    https://software-dl.ti.com/mcu-plus-sdk/esd/AM243X/11_02_00_24/exports/docs/api_guide_am243x/EXAMPLES_DHRYSTONE.html


    - AM261x: 1.94 MIPS/MHz at 500 MHz

    https://software-dl.ti.com/mcu-plus-sdk/esd/AM261X/latest/exports/docs/api_guide_am261x/EXAMPLES_DHRYSTONE.html

    The normalized performance (DMIPS/MHz) is nearly identical at approximately 1.95 MIPS/MHz.

    In absolute terms:
    - AM243x: 1.96 × 800 = 1568 DMIPS
    - AM261x: 1.94 × 500 = 970 DMIPS

    AM243x completes Dhrystone 1.6x faster in absolute time, matching the clock ratio (800/500 = 1.6x).

    Dhrystone is specifically designed to fit entirely within L1 cache. The R5F has 32 KB I-Cache and 32 KB D-Cache. Dhrystone code plus data is small enough (only a few KB) to run entirely from cache after the first iteration. It effectively measures CPU plus cache performance only, not memory subsystem performance.

    Your application with 1 MB code size is the critical difference. 1 MB code cannot fit in the 32 KB I-cache. Frequent cache misses force instruction fetches from MSRAM/OCSRAM.

    The memory penalty comparison:
    - AM243x: 51 cycles wasted per cache miss
    - AM261x: 24 cycles wasted per cache miss

    AM243x wastes more than twice the cycles per memory access (51/24 = 2.125x). This additional memory penalty nearly cancels out the 1.6x CPU clock advantage, resulting in similar overall execution time for memory-bound applications.

    SUGGESTED TESTS TO VALIDATE

    Test 1 - Measure Cache Miss Rate:
    Use the R5F Performance Monitoring Unit (PMU) to measure cache misses. Enable counters using PMCNTENSET. Use Event 0x01 for I-cache refill (instruction cache miss) and Event 0x03 for D-cache refill (data cache miss). Compare cache miss counts between Dhrystone and your 1 MB application.

    Test 2 - Run a Subset from TCM:
    If possible, identify the hottest 64 KB of your code and place it in TCM using linker placement or section attributes. Then measure if performance improves significantly. This would confirm that memory access latency is the bottleneck.

    Regards,

    Anil.