AM2432: AM2432 DLR Network Fault under large traffic conditions

Part Number: AM2432

DLR Ring Network Fault Report

1. Overview

The devices are based on the AM2432 and are networked in a DLR (Device Level Ring) topology. Under specific traffic conditions, the ring network malfunctions, exhibiting symptoms such as nodes repeatedly reporting faults, a flood of abnormal frames on the network, and out-of-bounds memory writes. It is suspected that the PRU firmware has entered an uncontrollable state.

2. Network Topology and Reproduction Steps

The network topology is shown below: there are only two devices in the network, both based on the AM2432, and packets are captured with an ET2000.

image-20260812163429971.png

Reproduction steps:

  1. Initial state: the two devices form a ring network with no communication between them; the network operates normally.

  2. Trigger: the application programs on the two devices are run so that the devices exchange data with each other.

  3. Result: the ring network malfunctions immediately, exhibiting various abnormal behaviors (detailed below). The packet capture is available in error_packet.zip.

3. Observed Symptoms

  1. Ring nodes repeatedly report unexpected loop, followed by a "linear / normal" status, cycling between the two states; meanwhile, the ring manager reports a ring network fault.

  2. A large number of abnormal error frames appear on the network:

    image-20260812164026610.png

  3. The ICSSG memory is configured as 64K in the program (linkr.cmd below). Debugging reveals an out-of-bounds write: the EIP_GUARD protected region is also modified, and the overwriting data is identified as DLR frames:
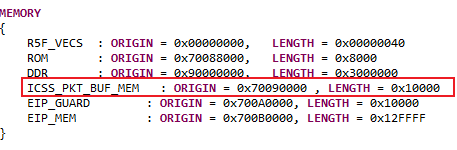
    image-20260812164052233.png

    image-20260812164243139.png

  4. A node device that is not configured as the ring manager nevertheless floods the network with beacon frames (this phenomenon was not captured in the current capture file, but has been observed previously).

  5. While the abnormal state persists, the device repeatedly prints error logs:

    image-20260812164739363.png

    image-20260812164704029.png

  6. At some point, a device becomes unable to transmit data frames.

The list above covers only the symptoms recorded so far; other anomalies exist as well. It is suspected that the PRU has gone abnormal and entered an uncontrollable state.

4. Reproduction Conditions

The problem does not occur when the data volume exchanged between the two devices is small; when the data volume is large, the problem is reproduced 100% of the time.

5. SDK Versions

The SDK versions used when the problem occurs:

  • ind_comms_sdk_am243x_2026_00_00_06

  • mcu_plus_sdk_am243x_12_00_00_26

  • Hi Wang, 

    The packet capture is available in error_packet.zip.

    I could not find the capture in this thread. 

    Under specific traffic conditions

    I wanted to know the traffic conditions in details, Is there any other external traffic or is this seen in particular pattern - packet size or traffic rate or EIP CIP packets or other non real time packets etc..?

     might have follow up questions - May be RX/TX buffer desc tracking etc..,

    BR
    JC

  • Hi JC,

    The attached file below is the file error_packet.zip. Thanks.

    /cfs-file/__key/communityserver-discussions-components-files/908/error_5F00_packet.zip

    I wanted to know the traffic conditions in details, Is there any other external traffic or is this seen in particular pattern - packet size or traffic rate or EIP CIP packets or other non real time packets etc..?

    Can be observed from wireshark captured package.

    Linjun

  • Hi Jayachandran,

    The customer has confirmed that all traffic packet captures are included in the error_5F00_packet.zip file. The archive covers the complete traffic flow from normal operation through the point where the issue occurred.

    Since we have already collected the packet capture covering the entire reproduction window and the issue is still under investigation, could you please help escalate this case to the appropriate expert team for further analysis?

    Please let us know if any additional logs, register dumps, or debugging information are required from the customer.

    Regards,
    Linjun

  • Hi Linjun

    To help diagnose the potential memory corruption issue, could you please collect the following debug information:

    1. ICSS EMAC Handle Parameter Validation

    Verify that the ICSS EMAC handle parameters remain intact and uncorrupted throughout operation
    A similar issue we investigated and resolved previously was traced back to EMAC handle corruption occurring within the customer's implementation.

    2. TX/RX Buffer and Descriptor Boundary Checking

    Implement tracking for both TX and RX buffer addresses and their corresponding descriptors
    Validate that these addresses stay within their allocated memory ranges
    Perform this check every time a packet is submitted to catch any out-of-bounds access


    3. RX-Specific Since the RX path shows more evident issues:

    Add logging in the RxCallback function to capture:
    RX buffer addresses being used
    RX descriptor addresses


    Goal: This will help us confirm whether there is any corruption of RX buffer addresses stored in the RX descriptors, or if the corruption occurs elsewhere.

    Could you ask customer to implement these logging points and share the captured data? 

    BR
    JC

  • Please share the complete ICSS memory dump as well. 

    ICSS dump AM64x/243x

    ICSSG0: 0x030000000 to 0x03003C0FF

    ICSSG1: 0x030080000 to 0x0300BC0FF

    BR
    JC

  • Share the ICSS dump before and after the issue occurs.

    BR
    JC

  • In addition, we tried this topology discovery and it worked without any issues.

    The above is our driver code, and the rest of the content is provided in the SDK. Please help check if there are any issues.

  • 4087.icssg_memory.dat

    This is this dump data for ICSSG0 and ICSSG1. 

  • icssg_memory_normal.dat

    The file uploaded just now is the dump file under fault conditions. This one is the dump file under normal conditions.

  • Hi Team

    After comparing the "icssg_memory.dat" and the "icssg_memory_normal.dat" 's ICSSG1 section (0x30080000 onwards), we see a repeated pattern of 0x00F20000 in the case which is not normal. This indicates a corruption of the ICSS Shared RAM and especially the DLR State Machine related addresses - which can cause the unpredictable and inaccurate behavior seen.


    In order to check what's writing these values into the memory - I'd recommend putting a Hardware Watchpoint on some of these physical addresses and check what's writing the unexpected values in the failure case:

    I'm especially interested to check the value being written to the "0x30090160" location - since this corresponds to the "DLR_ENABLED_OFFSET" and 0x00F20000 is definitely not something that we expect here.

    In order to add a hardware watchpoint in Code Composer Studio (CCS), refer to the following steps:

    1. Open the breakpoints dialog by selecting View → Breakpoints from the top menu bar.
    2. Click the small down arrow next to the New Breakpoint icon inside the Breakpoints view tab.
    3. Select Hardware Watchpoint from the dropdown menu.
    4. In the Location/Address field, enter the physical address.
    5. In the Memory/Access Type field, select your trigger behavior: Write, Read, or Read/Write.
    6. Click OK to activate it.

    Please note that you need to halt the R5 core before adding the watchpoints and then resume the core -> followed by putting it in the setup to reproduce the issue.

    Regards,
    Archit

  • Hi  Archit

    As email replied, the breakpoint is not stopped but the register is changed.

    Thanks

    Zekun

  • Hi Zekun,

    While I am working on the ICSS EMAC Driver side logging, I had another question about the customer implementation:

    1. Does the customer application have multiple threads that can perform transmit from the DUT?
    2. If yes, can the customer implement a mutex/lock before calling the ICSS_EMAC_txPacket function in order to prevent data corruption caused by multiple threads trying to transmit data at the same time?

    Let me know if you need help with any of the above points.

    Regards,
    Archit

  • Hi Archit

    We are using the RT‑Thread OS and perform locking via the above interfaces, yet tests show this has no effect.

    Additionally, I have observed a phenomenon: when the device is configured as a DLR node, everything works fine if its Ethernet port is not connected to the manager device. Once the supervisor is connected, the memory range from 0x30090400 to 0x30090700 gets overwritten cyclically. The write operation occurs roughly every 1 second, with the value 0xF10000 or 0xF20000 (depending on which Ethernet port is used). These values match the incorrectly‑written values we saw during yesterday’s tests. It is unclear whether there is any correlation, and this information is for your reference.

  • Hi Archit

    May I check the status of script logging data of TX? Have you finished and test it to share it with customer?

    Thanks

    Zekun

  • Hi  ,  

    The ICSSG memory is configured as 64K in the program (linkr.cmd below). Debugging reveals an out-of-bounds write: the EIP_GUARD protected region is also modified, and the overwriting data is identified as DLR frames:

    image-20260812164052233.png

    I see that this specific region has been moved from "0x70000000" as mentioned in our reference examples to 0x70090000. Any specific reason for this?

    Also, the PRU cores use a translated address via the Region-Based Address Translation (RAT) -> and our default examples use 0x70000000 for this mapping, is this taken care of in your codebase?

    Regards,
    Archit

  • Hi, 

    Based on your previous screenshots - I see that this is taken care of and there are no issues due to this.

    Regarding the logger:

    • It keeps a per-(port, queue) circular log of TX/RX queue-pointer and buffer-address activity in Switch Mode. Each entry (ICSS_EMAC_QTraceEntry) records:
      • seqNum — monotonic counter
      • eventType — one of RX_RDPTR, RX_BUFPTR, TX_WRPTR, TX_BUFPTR, or ERROR
      • port, queueNum, emacMode
      • oldPtr/newPtr — previous/new rd_ptr or wr_ptr value (or BD index for buffer events)
      • bufAddr — computed L3 OCMC buffer address, or the error reason code (1=out-of-range, 2=misaligned, 3=bad-delta) for ERROR entries
    • These live in gIcssEmacQTraceLog[port][slot] — a [3][5] array (3 ports, 4 priority-queue slots + 1 collision slot), each holding a 128-entry ring buffer plus writeIdx/seqCounter.
    • The logger calls ICSS_EMAC_qtraceCheck(), which sanity-checks the new pointer value against that queue's buffer_desc_offset/queue_size (range, alignment, forward-distance from the old value).
      • If the check fails, it logs one ERROR entry and spins in while(1) — a deliberate halt so a debugger can inspect state at the exact point of detection.

    I am attaching the zip with the updated ICSS EMAC sources with the Logger here: icss_emac.zip

    Some points regarding the integration:

    • Logger location: source/networking/icss_emac/source/icss_emac_qtrace.{c,h}
    • My recommendation would be to backup the existing icss_emac sources and then replace your current sources with those from the zip
    • The logging is already enabled but I'd like to explicitly call out the toggling methodology:
      • To enable the feature: Add `#define ICSS_EMAC_QUEUE_TRACE_ENABLE` in `icss_emac_local.h`
      • Optionally also add `#define ICSS_EMAC_QTRACE_LEAN` for a zero-history, halt-only mode if RAM is tight.
        • NOTE: This is disabled in the zip to ensure more extensive logging, and we'd recommend to keep it this way.
    • This is compiled into the icss_emac static library, not something toggleable from the app side. Enabling or disabling it requires rebuilding mcu_plus_sdk's icss_emac lib itself

    Usage:

    • Inspect `gIcssEmacQTraceLog` directly via the CCS Expressions window or memory browser - it's declared non-static specifically so it's visible by name from any debug session, without needing a live handle to the driver object.
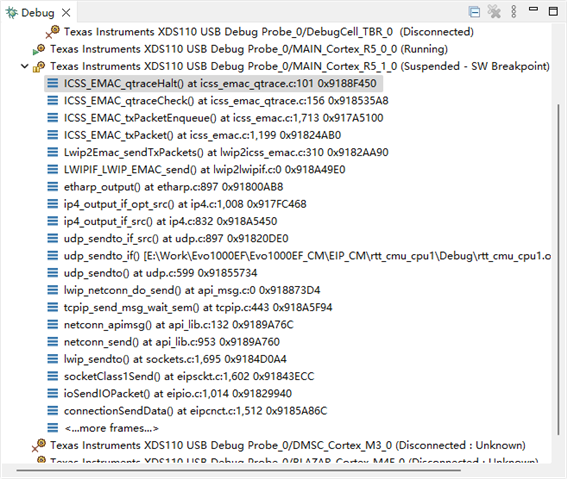
    • Add a breakpoint in the "ICSS_EMAC_qtraceHalt" to know when an incorrect write is detected.
    • For a quick sanity check to ensure things are working - check the gIcssEmacQTraceLog to see if the transmit/receive variables are changing. 

    Once the while(1) loop is reached in the code, please share all the variables in the function context.

    Regards,
    Archit

  • Hi Archit,
    Just to clarify: All the phenomena we are discussing and the device under debug are acting as a DLR Ring Node. The other AM2432 works as the DLR Supervisor.
    As I mentioned in the earlier thread, we have done another test: when both AM2432 devices are configured as Ring Nodes, with a separate third‑party device acting as the DLR Supervisor, the issue does not reproduce.
    From this observation, could we infer that the root cause originates when AM2432 acts as the DLR Supervisor, and this condition in turn triggers faults on the Ring‑Node‑side AM2432?
    Moving on to the qtrace log test:
    I set a breakpoint at the while(1) loop. The original problem reproduced, but the breakpoint never hit. I retried multiple times and waited for a long period, still no breakpoint trigger.
    However, once I enabled the Supervisor on this debugged Ring‑Node device, the breakpoint triggered immediately.
    The fault occurs inside function EIP_DLR_serviceRingSupConfigSetRequest. Please refer to the attached screenshot for the detailed backtrace, and the screenshot for variable values.
  • Hi Wang

    Thanks for the logs - we can clearly see the error being Write pointer is out of range.

    From this observation, could we infer that the root cause originates when AM2432 acts as the DLR Supervisor, and this condition in turn triggers faults on the Ring‑Node‑side AM2432?

    That is the likely reason - possibly some configuration that's performing an overlapping write into the ICSS Memory corrupting this value. If you see the log here - the prevPtrVal is 356 (0x164) which is incorrect.

    In order to track the pointer writes of the previous packet rx/tx - can you share the values of the gIcssEmacQTraceLog structure?

    Regards,
    Archit

  • Is there any good way to quickly export the full values of this structure? Alternatively, can I provide you with the memory dump of this array?

  • Hi Wang,

    Memory dump of the full structure is fine. 

    Also, something that we can try with DLR Supervisor enabled (considering its much quicker to reproduce) - put a hardware watch-point on 0x30083E9C and 0x30083E9E and check if the value being written is less than 0x400. This is slightly tedious but it looks like we cant do a Hardware Watchpoint on a specific value in CCS for Cortex R5 Cores.

    Regards
    Archit

  •  gIcssEmacQTraceLog.dat

    Hi Archit,
    I am attaching the variables captured at fault time as well as the full memory dump of gIcssEmacQTraceLog. The backtrace remains the same as before.
    Regards,
    Wang
  •  6087.gIcssEmacQTraceLog.dat

    Hi Archit,

    I retested by changing the address to 0x70000000. This time the program halted by itself at the while(1) location. The corresponding backtrace, variable values and memory dump are attached.

    Regards,

    Wang

  • Hi Wang

    Thanks a lot for the results, they've been helpful in understanding the issue. 

    I am attaching the variables captured at fault time as well as the full memory dump of gIcssEmacQTraceLog. The backtrace remains the same as before.

    With this log, on the Port 2, Queue 0:

    Packet 1: normal.
    - wr_ptr: 0x1630 → 0x1638 (valid, one BD-size step of 8)

    Packet 2: corruption appears here.
    - wr_ptr: 0xc → 0x14 ← this is the value actually written to hardware; note it's not a continuation of 0x1638, it's a completely different, much
    smaller number, which starts to cause the corruption.

    So the value was corrupted even before the packet was transmitted.

    I have checked the PRU firmware which seems innocuous and the writes seems to be well behaved. So its possible that the Host Core is somehow corrupting this memory address.

    Also, something that we can try with DLR Supervisor enabled (considering its much quicker to reproduce) - put a hardware watch-point on 0x30083E9C and 0x30083E9E and check if the value being written is less than 0x400. This is slightly tedious but it looks like we cant do a Hardware Watchpoint on a specific value in CCS for Cortex R5 Cores.

    Can you please try this on your end if possible, while also putting a breakpoint in the ICSS_EMAC_qtraceHalt function?

    • Port 1, Queue 0:
      • Read Pointer Address: 0x30082000 + 0x1E9C (16 bit value)
      • Write Pointer Address: 0x30082000 + 0x1E9E (16 bit value)
    • Port 2, Queue 0:
      • Read Pointer Address: 0x30082000 + 0x1EBC (16 bit value)
      • Write Pointer Address: 0x30082000 + 0x1EBE (16 bit value)

    Regards,
    Archit

  • Hi Archit

    I have performed multiple debug attempts. When the issue occurs, the hardware watchpoint does not hit. However, I can observe the value at this address keeps changing in the memory browser. It seems this memory location is not being modified by my application code. Taking the content from the screenshot as an example, the watchpoint set at 0x30083E9E never hit, while the value in memory had already changed.

    Regards,

    Wang

  • We found a new behavior: when the two devices start communicating , the capture shows Announce and Sign_On being sent very rapidly. Debugging points to the cause: EIP_DLR_port0ISR / EIP_DLR_port1ISR (triggered by the DLR_RING_NORMAL_TRANSITION_MASK bit in the common-event byte) keep firing.

    We added counters in the host ISRs; the event fires once per beacon interval:

    1 s: normal_trans +166  (P0 +2   P1 +164)
    2 s: normal_trans +2518 (P0 +28  P1 +2490)   <- 1/400us = beacon interval
    3 s: normal_trans +1659 (P0 +15  P1 +1644)
    

    Meanwhile the capture shows the beacon Ring State stays NORMAL, beacon sequence IDs are continuous, and there are no fault-related frames at all (see attached dlr_most_sign_on_announce.pcapng).

    In other words, with the ring stable in NORMAL and the host state machine already in NODE_NORMAL, the PRU keeps asserting the "ring normal transition" event every beacon interval (~2500 times/s). The SDK host stack treats each one as a real recovery (transmitting Announce + Sign_On), which is the rapid burst we see.

  • Hi Wang,

    On the second issue that you're encountering with the SignOn frames:

    1. Is this issue seen when the Device is acting as the DLR Active Ring Supervisor? Or is this seen in the DLR Node case as well?
    2. Is there any trigger post which this starts to happen - any specific event? Or does it happen each time?
    3. Can you also enable the DLR Event logging and share the dump with us : https://software-dl.ti.com/processor-industrial-sw/esd/ind_comms_sdk/am64x/2026_00_00_06/docs/api_guide_am64x/ICSS_DLR_DESIGN.html#autotoc_md368 

    Regards,
    Archit

  • Hi Wang,

    We have found a potential race condition between the PRU and the Host Core which can cause wr ptr corruption. I'm attaching it here: EIP_100M_VER_05_05_24_DEBUG_01.zip

    Can you try this "EIP_100M_VER_05_05_24_DEBUG_01" and check if it helps with the issue # 1?

    In the mean-time we're working on a Firmware Tracing implementation which can help us pinpoint the exact cause of corruption of the wr ptr.

    Regards,
    Archit

  • Hi Archit

    I have tested this new firmware, but it shows no improvement. The behavior remains exactly the same as before.

    Regards,

    Wang

  • Hi Archit

    This issue occurs when the device acts as the Active Ring Supervisor. However, after swapping the roles of the two devices (the original Node becomes Supervisor and the original Supervisor becomes Node), the symptom changes. It appears to turn into a network storm, even though both devices run the exact same firmware.

    Therefore, I suspect this problem is a side‑effect of the earlier wr_ptr corruption issue. We can revisit this symptom after the pointer issue is resolved.

    Regards,

    Wang

  • Hi Wang,

    > Therefore, I suspect this problem is a side‑effect of the earlier wr_ptr corruption issue. We can revisit this symptom after the pointer issue is resolved.

    It is likely. We have been able to develop a logging mechanism in the PRU to identify the fault location - currently running some tests.

    We'll share it as soon as possible.

    Thank you for your patience.

    Regards,
    Archit

  • Hi Wang,

    I am attaching the Firmware Logger here: EIP_100M_VER_05_05_24_DEBUG_02.zip

    You will have to integrate these firmware headers and rebuild the EIP FWHAL library.

    You can refer to the usage details in the attached readme, but summarizing it here.

    • Once the initialization is done and the PRU firmware is loaded , write 1 to the following physical address: 0x30092FB8 via memory browser.
    • You can keep monitoring the Write pointer, and when you detect the corrupted value written, you can dump the memory from 0x30092F00 to 0x30093000. This contains meta-data which will help us analyse the logs and find the culprit - and also whether its the PRU cores or somewhere outside of the subsystem.

    NOTE: Please note that when the wr pointer is corrupted, the PRU cores would halt. 

    Regards,
    Archit

  • WRPTR.dat

    Hi Archit

    I have performed the test. The values at 0x30083E9E and 0x30083EBE were not modified to values below 0x400. However, I observed a mismatch between 0x30083E9C and 0x30083E9E, while these two values are normally identical. At this moment, Wireshark capture showed communication interruption, which indicates the issue has been reproduced.

    I checked the address range you provided. Only 0x30092FEC was non‑zero, consistently showing 0x00040101 across multiple test runs. The memory dump file is attached.

    Best Regards,

    Wang

  • Hi Wang,

    Thanks for running the test. The logger was written in a way that it'd halt the PRU core before it makes the incorrect write. So the write pointer not going below 0x400 is expected if the PRU was making the illegal write.

    With these logs it's clear that the PRU cores have been corrupting the memory and based on the logs and preliminary analysis - it looks like a Port Queue arbitration related race condition.

    We've made some fixes in the PRU firmware around this - request you to kindly test it. The logger is still present inside the PRU firmware, so in case of a communication halt, please dump the memory and share it with us.

    EIP_100M_VER_05_05_24_DEBUG_03.zip

    Regards,
    Archit

  • 3583.WRPTR.dat

    Hi Archit

    The issue still occurs with identical symptoms as before. The memory dump has been attached.

    Regards,

    Wang

  • Hi Wang

    Just a quick confirmation - do you have link up/down scenario in your test case? 

    Regards,
    Archit

  • Hi Archit

    No link-up and down in test case. Test case is as before,  the issue happen after the PLC application running.

    Thanks

    Zekun