This thread has been locked.

If you have a related question, please click the "Ask a related question" button in the top right corner. The newly created question will be automatically linked to this question.

Random BUS Fault = RESC REG7 SW error 0x11

Guru 56178 points

Other Parts Discussed in Thread: SYSBIOS

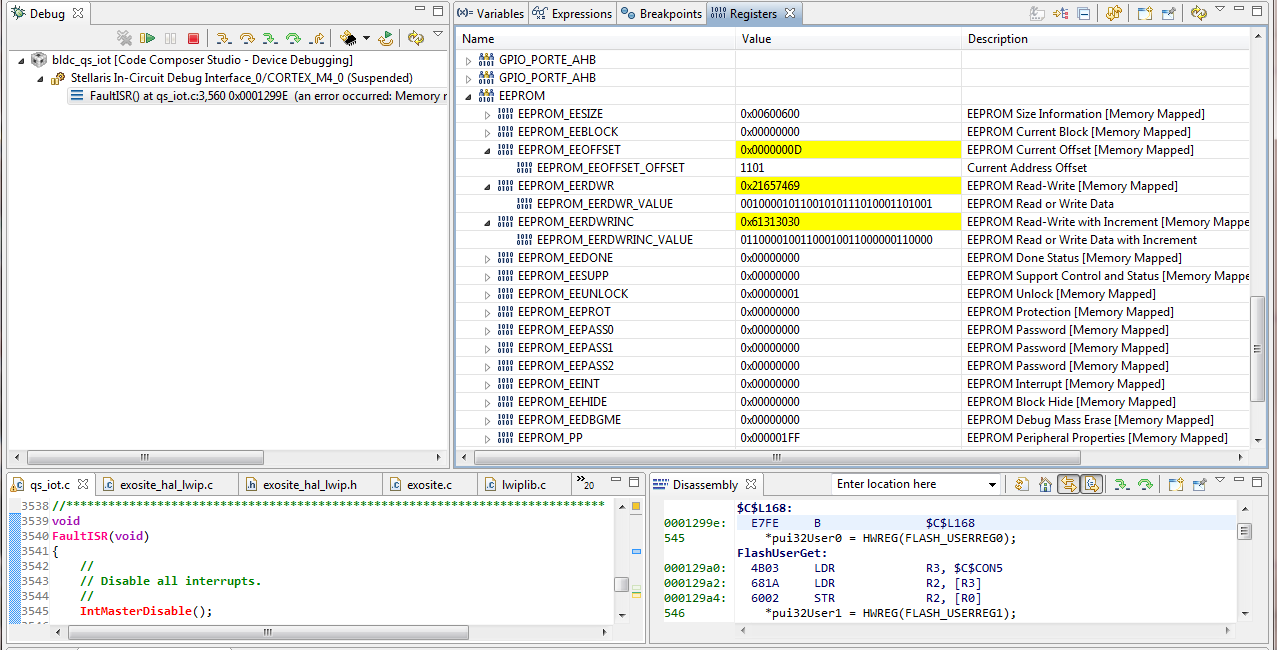
CCS debug shows the address of the Bus Fault to be in SRAM although EEROM read is suspect to be cause of the error. CCS 4dDebug simpulator only highlights the EEROM peripheral registers in yellow, might indicate trouble area?

FAULTSTAT REG 65 BFARV bit 15 is set true indicating a valid Fault address in SRAM & valid exception fault handler interrupt priority took place.

 EK-TM4c1294NCPDTI3-XL

At this time not really sure how to back tracking the memory address into the SW inflicting this awful symptom.

Debug information around the error:


The following conditions generate a fault:

■ A bus error on an instruction fetch or vector table load or a data access.
■ An internally detected error such as an undefined instruction or an attempt to change state with
a BX instruction.
■ Attempting to execute an instruction from a memory region marked as Non-Executable (XN).
■ An MPU fault because of a privilege violation or an attempt to access an unmanaged region.

In a fault handler, the true faulting address can be determined by:
1. Read and save the Memory Management Fault Address (MMADDR) or Bus Fault Address (FAULTADDR) value.
2. Read the MMARV bit in MFAULTSTAT, or the BFARV bit in BFAULTSTAT to determine if the
MMADDR or FAULTADDR contents are valid.

Software must follow this sequence because another higher priority exception might change the
MMADDR or FAULTADDR value. For example, if a higher priority handler preempts the current
fault handler, the other fault might change the MMADDR or FAULTADDR value.

2.6.1 Fault Types
Table 2-11 on page 122 shows the types of fault, the handler used for the fault, the corresponding
fault status register, and the register bit that indicates the fault has occurred. See page 182 for more
information about the fault status registers.


Fault                  |   Handler  |     Fault Status Register        |   Bit Name

Precise data bus error   Bus fault     Bus Fault Status (BFAULTSTAT)        PRECISE


Register 65: Configurable Fault Status (FAULTSTAT), offset 0xD28

Bit/Field Name   Type Reset    	Description
_________________________________________________________________________
BIT[15]   BFARV  RW1C    0    	Bus Fault Address Register Valid

			      Value  Description

				0 The value in the Bus Fault Address (FAULTADDR) register
				  is not a valid fault address.
				1 The FAULTADDR register is holding a valid fault address.
				  This bit is set after a bus fault, where the address is known. Other faults
				  can clear this bit, such as a memory management fault occurring later.
				  If a bus fault occurs and is escalated to a hard fault because of priority,
				  the hard fault handler must clear this bit. This action prevents problems
			 	  if returning to a stacked active bus fault handler whose FAULTADDR
				  register value has been overwritten.

				  This bit is cleared by writing a 1 to it.
___________________________________________________________________________
Bit[9]  PRECISE  RW1C   0      	Precise Data Bus Error
Value Description
                          	0  A precise data bus error has not occurred.
                             	   A data bus error has occurred, and the PC value stacked for
                             	   the exception return points to the instruction that caused the fault.
                          	1  When this bit is set, the fault address is written to the FAULTADDR register.
                             	   This bit is cleared by writing a 1 to it.


  • BP101 said:
    CCS debug shows the address of the Bus Fault to be in SRAM

    Does it?    Is 0x0001.299E an SRAM address?     You don't state your MCU but "if" the address listed is that shown - question may arise.

    I do see and agree with your identification & presentation re: BIT[15] - is that 0x0001.299E address (w/in your ISR) part of an "unmodified, factory supplied ISR?"

    Your much modified (likely not fully documented) huge code size renders "A-B" testing by Amit very difficult - does it not?    "Straying" too far from the herd has advantages - and sometimes (unfortunate) consequences...

    And - what changes have recently been made which (now) bring this issue into play?

  • "Straying" too far from the herd has advantages - and sometimes (unfortunate) consequences... Trouble shooting the bus fault breakdown point to include more robust error return traps in suspect areas is the first step to stopping unwarranted bus faults. BTW bus faults only occur in the Exosite client module and not in the BLDC client Telnet module.

    Not to sure the EEROM debug is showing any bus fault status, the NVIC is documented to point to the address of bus fault.

    Take a second look at NVIC_FAULT_ADDR = the BusFaultAddress [Memory Mapped]  above post.

    This better debug capture shows an even different bus fault address in the EPIO module range. The peripheral is now disable, by default has power control enabled in SYSCTRL register. BFARV[15] was not showing above post and is in this debug capture.

  • Been fighting bus fault for near 2 months. That BOR crippling DAP, finally a WA 1 second delay after MOSC clock is asserted allows CCS debug simpulator time to capture the DAP. Recently added a function call to configure both DOGS and call to invoke them can be disabled during a debug RUN. Otherwise it is impossible to pause the MPU order to view the system state with out receiving a simpulator error. So finally it is possible to pause the DAP after MPU halts trapping into FaultISR. For some reason CCS5.4 debug can not pause the DAP while the DOG is watching. :-)
  • BP101 said:
    This better debug capture shows an even different bus fault address in the EPIO module range.

    The different debug screen captures seem to show a different address causing the fault each time.

    I would suspect some sort of memory corruption, E.g. a stack overflow or code incorrectly writing off the end of arrays.

    Does your program use an OS (e.g. TI-RTOS) ?

  • Hi Chester,

    Have to agree with that assessment and likely not EEROM to blame. We find (Ringbuf.c) uses an atomic update to increment buffer write index after it writes to SRAM. That atomic code a far reach above my head but suspect it might be responsible for vectoring the memory index address way off course causing a random data bus fault where NVIC gets upset.

    We don't use an IOS such a SYSBIOS or Free RTOS  so all Exosite IOT function calls are made using vanilla  Tivaware modules.


  • BP101 said:
    For some reason CCS5.4 debug can not pause the DAP while the DOG is watching. :-)

    For MSP430 devices the emulator knows to pause the Watchdog when the device is halted by the debugger. I am not aware of such software functionality in CCS when debugging Tiva devices.

    However, the Tiva Watchdog has a STALL bit in the Watchdog Test (WDTTEST) which when set the watchdog stops counting when the device is stopped with a debugger.

    Try calling the TivaWare WatchdogStallEnable() function and see if that stops the Watchdog reset when the device is halted by the debugger.

  • Try calling the TivaWare WatchdogStallEnable() function and see if that stops the Watchdog reset when the device is halted by the debugger.

    Great idea, if that could be done automatically even better.

    Oddly with both dogs completely disabled repeated debug launches show WDT0 is some how magically programmed with a reset timeout value of 0x1F40 (8000) and WDT1 reset timeout 0xFFFF.FFFF.

    Starting to question the TM4C1294 POR reset RC time constant either being to long or not enough as some registers end up with wacky values other than the documented reset values. Most reset circuits of the day typically incorporated a diode parallel with .1-10uf electrolytic capacitor.

    After much time spent on this issue it appears the ICDI TM4C123 (Debug_Reset_Out) is likely triggering the TM4C1294 (Target_Reset/3.2D) leading to a fatal bus error. That explains why after 2 moths of debugging the cause can not be directly targeted to any single function in the application. Seem to have missed this earlier that register 7 RESC = 0x11 infers no sticky bit set POR yet only the EXT+ SW bits remain sticky immediately after the very first RESC=0x3 indicating POR+EXT.

    Why would Launch Pads ICDI processor randomly inflict such brutal recourse. Well it might be the UART channel data from TM4c129 has backed up in the USB virtual serial CDL pipe into Windows and the ICDI processor either blows his stack or adverts the train wreck by dumping his cars. The application sends looping status messages to the console via UARTprintf() with heap sizes 4096k-16384k not helping the issue.  

  • Clearing the RESC register bits after the first reported POR/EXT event and the very next MPU reset has RESC = 0x8 WDT0 not SW+EXT.

    Dang these sticky bits are questionable since WDT0 is not being invoked at any point during the UARTprintf report.

    This could be the WatchDogStallEnable() recently added?

    // Print the reset cause resister bits
    g_ui32Status = (HWREG(SYSCTL_RESC));
    
    UARTprintf(">> Reset Cause -->>:%i\r\n" , g_ui32Status);
    
    g_ui32Status = 0x00000000;
    
    (HWREG(SYSCTL_RESC) = g_ui32Status);

  • BP101 said:
    Oddly with both dogs completely disabled repeated debug launches show WDT0 is some how magically programmed with a reset timeout value of 0x1F40 (8000) and WDT1 reset timeout 0xFFFF.FFFF.

    Starting to question the TM4C1294 POR reset RC time constant either being to long or not enough as some registers end up with wacky values other than the documented reset values. Most reset circuits of the day typically incorporated a diode parallel with .1-10uf electrolytic capacitor.

    Unless CCS is configured to assert a System Reset when starting a debug session, it is possible for register values to remain their values from a previous run which can cause such behavior. See Tiva registers do not reset between debug sessions for how to make CCS apply a System Reset when starting a debug session.

  • That last sticky bits report is/was UARTprintf() and the CCS debug register view of WDT0 just after POR, 1 sec program delay and quickly entering into CCS Debug which system resets after program loads. The watch dogs were not configured in CCS debug test yet they are peripherals and the registers had values.

    TivaWare WatchdogStallEnable() helped LM Flash to easily capture the DAP, thanks for that tip Chester. :-)

    Leashed both dogs to the house via robust constraints and dog-0 still barking at cars in the street. New outlook on dog bark reveals the RESBEHAVCTL default configuration is spot on. That is if we first clear the bits (g_ui32Status = 0) in the RESC register, that appears to unmasks the Reason for the EXT reset event rather than the cause of it. Amit tried to explain RESC behavior in an earlier post. Hard to grasp when the sticky cause was spot on and dog only alerts after the reset event is over and done with.

    Now alert to the dogs game, a handy digital logic probe catches the TMC123/ICDI toggling the TM4C1294 RST input pin. Million years would never expect that ICDI to interfere in that way yet it is and does. Explains why the TCP telnet client runs uninterrupted since he uses UARTprintf() but only for single one line messages. Appears Chester smelled stack issues and we very early on noticed LWIP heap corrupt causing MPU resets but never expected onboard ICDI might be aiding in that corruption.

    Possibly the TMC123/ICDI might require more heap space order to handle the looping UARTprintf() messages sent into the USB virtual serial CDL pipe.
  • BP101 said:
    Now alert to the dogs game, a handy digital logic probe catches the TMC123/ICDI toggling the TM4C1294 RST input pin. Million years would never expect that ICDI to interfere in that way yet it is and does.

    Some questions to try and understand what is the cause:

    1) Is there any software on the PC connected to the ICDI when the failure happens?

    i.e. is the CCS debugger and/or terminal program connected?

    2) Do you know the revision of the ICDI firmware?

    [It seems the only way to obtain the ICDI firmware revision is to select the ICDI Firmware Update button on LM Flash Programmer - which will report the current version before asking if you want to continue]

    3) Do you know the rate of message being sent by UARTPrintf when the failure occurred?

  • Chester Gillon said:
    digital logic probe catches the TMC123/ICDI toggling the TM4C1294 RST input

    Note the above is a BP101 quote.

    I would add - "How do you know that the ICDI (alone) commits that act?"    Should you be probing, "TM4C1294's RST" might several other events/sources prove suspect?     (your writing does not detail the logic probe's location - instead notes a result - which may not justify the conclusion.)

  • Oddly LM Flash refused to connect ICDI firmware update but would program the target LP. Later switched over to 2nd LP, has version 12630 and ICDI appears to randomly toggle the target RST pin.

    @CB1 - Both LP boards are seemingly toggling the targets RST pin, ICDI reset output is clearly marked RESET in huge letters. The schematic confirms the silk screen location. Thanks for chime in here!

    5.28.2015:

    Logic probe was picking up the WDT0 2nd timeout resetting the MPU and the RST pin was toggling internally. 


  • Also in reply to CB1

    Appears WDT0 is chasing his tail shown in todays RESC=0x8 from a different LP. The reset reload value on only WDT0 is not having any effect. RESBEHAVCTL register default is set to reset MPU on 2nd timeout of WDT0. The strange part is no function is punching the dog so the application NVIC fault must be interrupting the timer. 

    Random MPU resets make WDT0 reload timeout value a prime suspect. Chester mentioned it was CCS debug refresh above post but it appears simulator was spot on. The WDT0 reload value(120000000/15000) 125us and WDT0 didn't seem to care what value was being set in the register, as it still timed out resetting MPU. Making timeout value reflect milliseconds and the MPU won't even initialize.

    5.28.2015:

    The WDT0 reload value 125us is randomly allowing the dog to reset the MPU and (120mHz/150) 1.25us. The 1.25us was less aggressive during application periods of extend wait delays that are built into the Exosite IOT code. Changed WDT0 reset disable forces NVIC exception 0x11 into the Halt trap ISRFault() handler so the register contents can then be examined. That is impossible to do if the WDT0 constantly resets the MPU.

    ROM_WatchdogResetDisable(WATCHDOG0_BASE);