This thread has been locked.

If you have a related question, please click the "Ask a related question" button in the top right corner. The newly created question will be automatically linked to this question.

TM4C123GXL: Diagnosing a Bus Fault Error

Other Parts Discussed in Thread: EK-TM4C123GXL

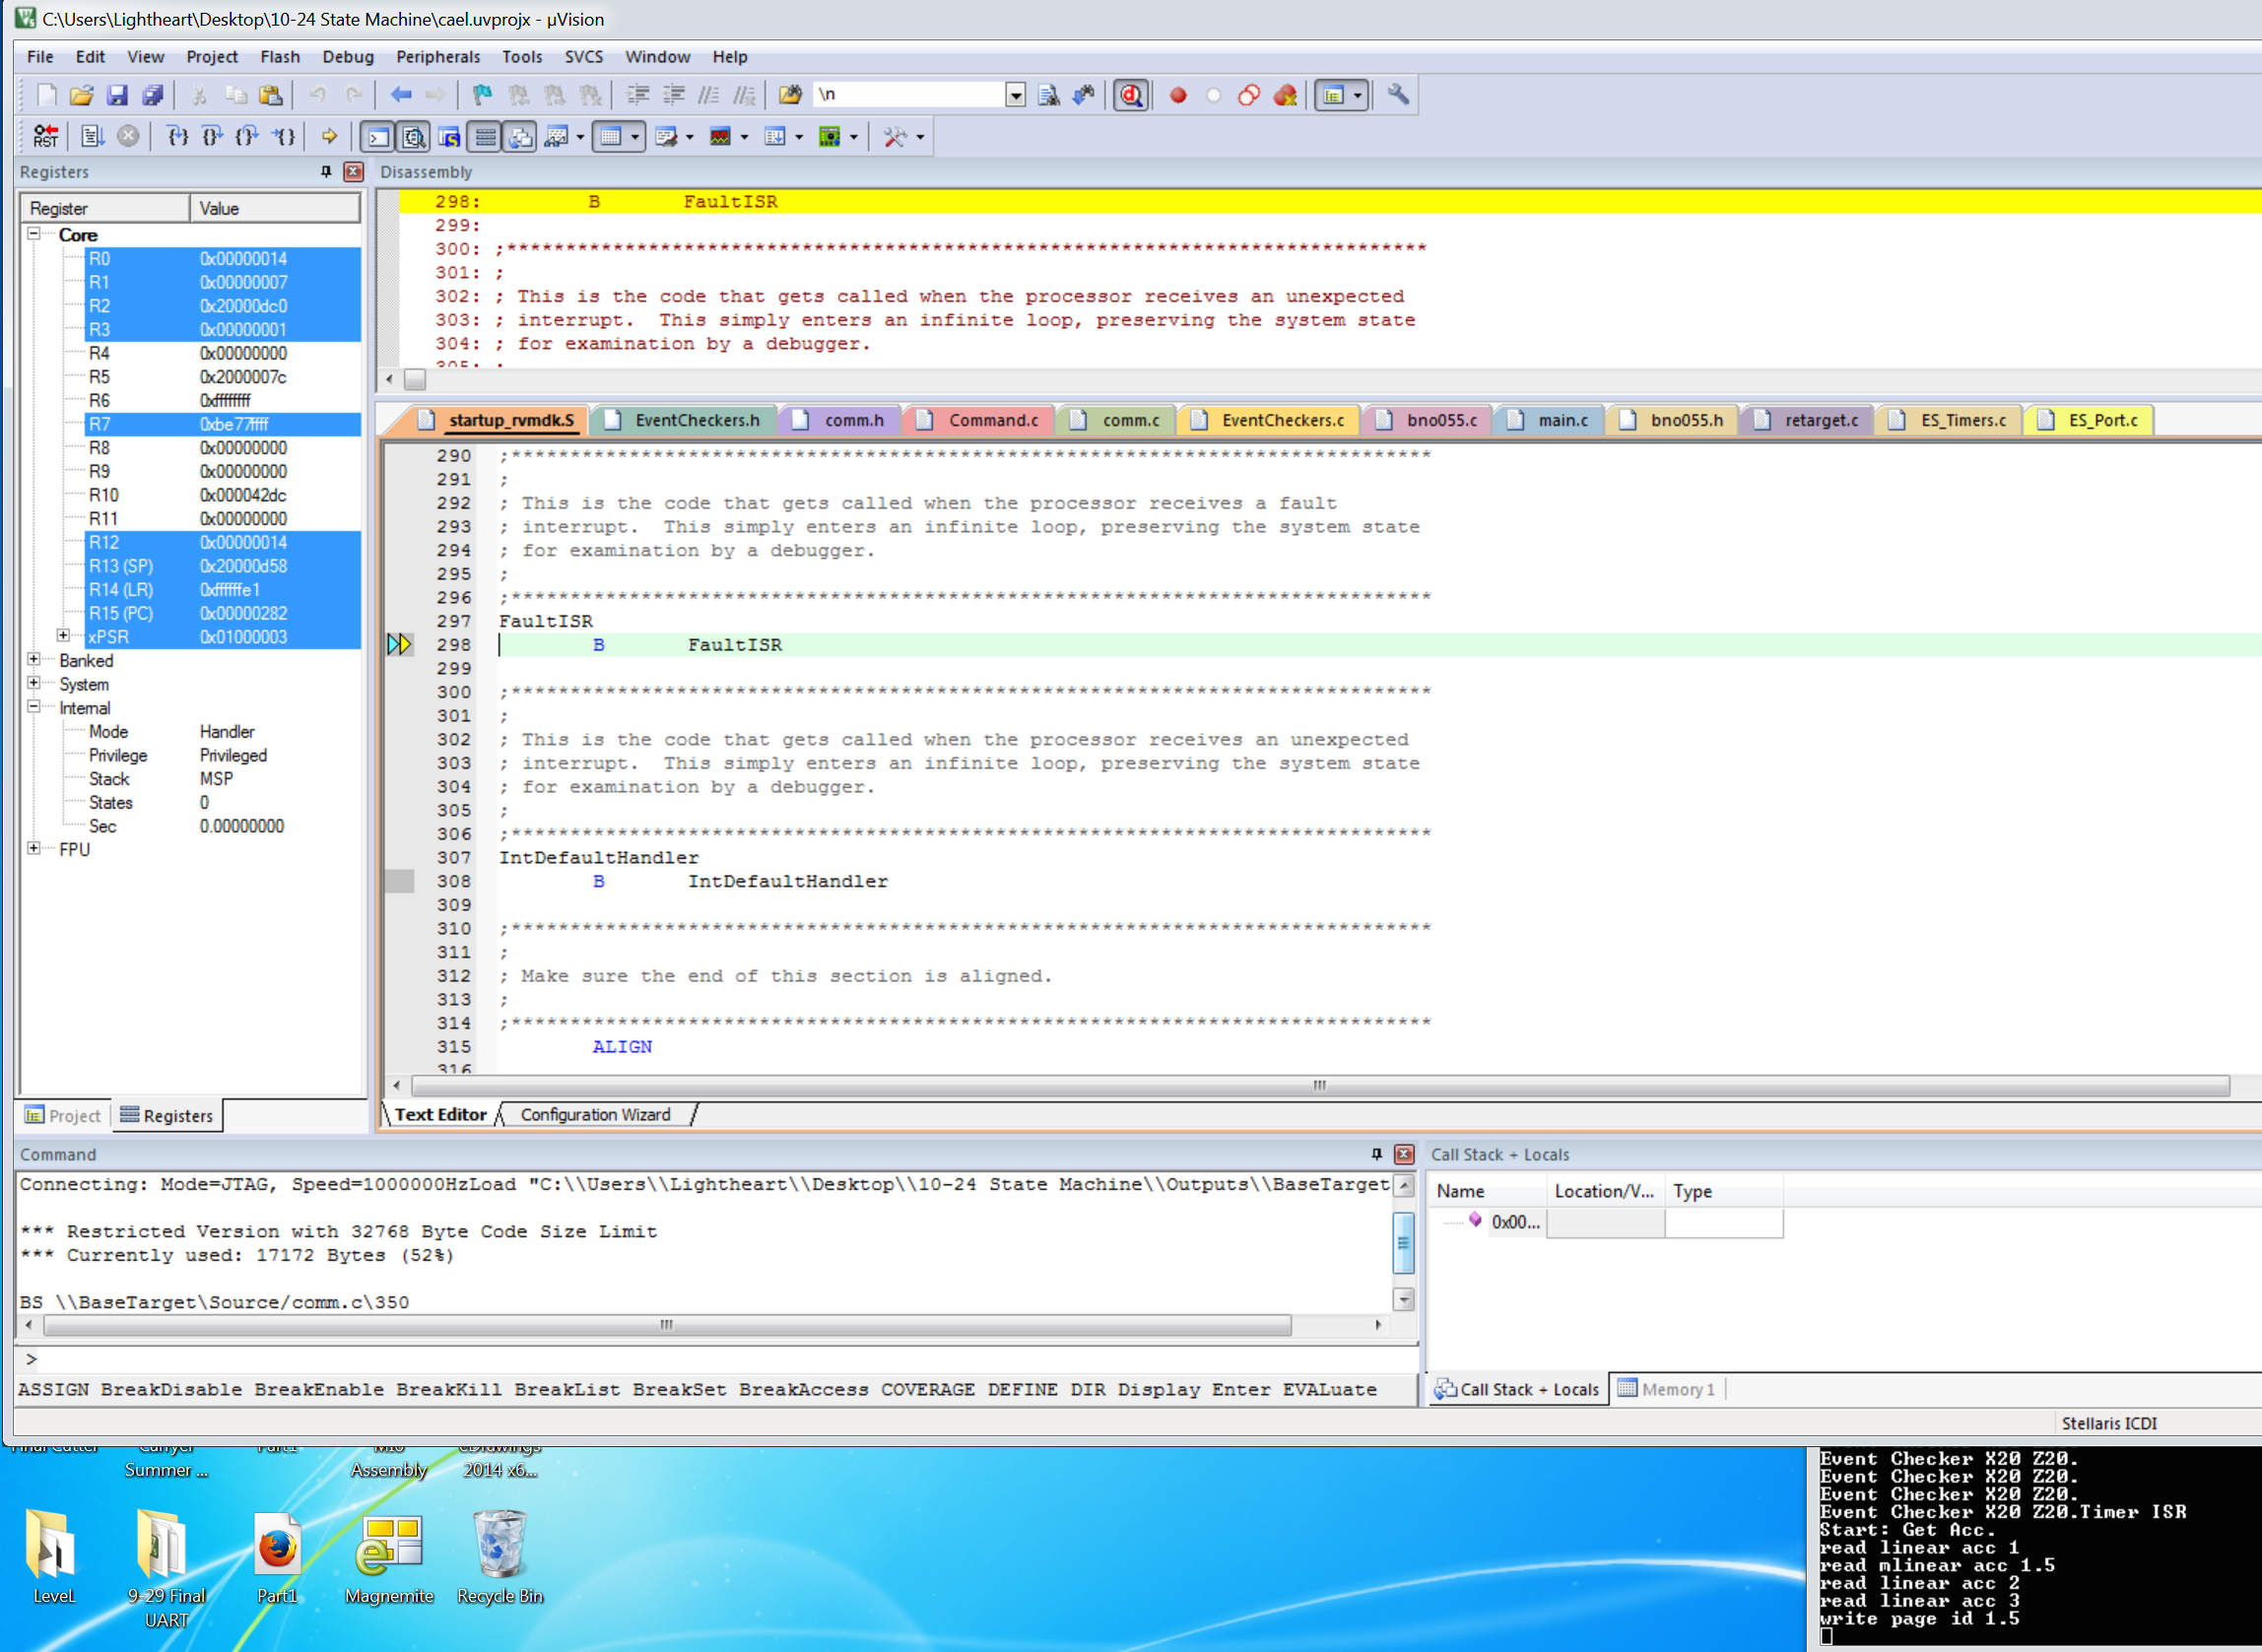
Hi guys. I'm finding myself in my Fault ISR, but I don't know how to diagnose why. Any guidance appreciated. Here is the context:

As some of you know, I am working on a project where I get data from a bno055 9-axis IMU via I2C and integrate it into position. It took me a while to figure out how to integrate the Bosch bno055 generic library into my project, but with this forum's help I figured it out. Afterwards, everything is/was going pretty well. I had a periodic timer repeating very 20 ms. Every time it ran out I went into my timer ISR, where I grabbed new data from the sensor and integrated it.

I moved my code over to an Event and Services framework written by my professor. This framework allows for the posting of events from different modules, and streamlines more complex code such as multiple state machines and hierarchical state machines. This framework was written to work with the tm4c123gxl microcomputer. I migrated my code over into it, still using a periodic timer interrupt to get my data. But my code started hanging with the ISR. I traced the hanging to within my get_acceleration function particularly the line where I read from my bno055.


A lot more experimentation happened and it turns out the problem isn't linked to my timer ISR, but I'm mysteriously hanging when I read the bno055 within my get_acceleration function. The weird thing is that I call that same function during my initialization routine and get through it just fine.

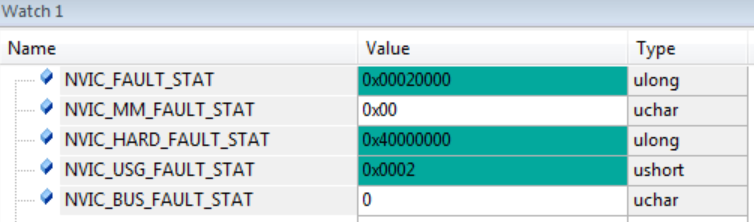
So when I follow the Keil debugger I get through my read and writes to the bno055 during bno055 initialization and even calling this get_acceleration function during my setup routine, but when I try to call the function later on I get into my Fault ISR. I just don't know why I'm going to my Fault ISR. Is there some sort of register that will give me a bit more information on the fault so I can start figuring out what is happening? Thanks.

  • Hello Zero PD,

    First place to start is here

    e2e.ti.com/.../374640

    And then

    www.ti.com/.../spma043.pdf

    Regards
    Amit
  • Thanks Amit for pointing me in the right direction.

    Board: EK-TM4C123GXL Rev. A.

    IDE/Debugger: Keil uVision v5.15

    I started reading the first link, then following the instructions in the second link. I studied the debugger till I finally found Symbols>Special Functions Registers, added the NVIC Fault Status registers to my watch list and stepped through my code until the fault line. After I stepped through the faulting line and found myself in the Fault ISR, the status registers changed from all 0x00 to:

    I opened up the tiva datasheet to figure out what this meant. Once I located the USG Fault Stat register, it turns out that Bit17/INVSTAT - Invalid State Usage Fault - was high. The description was as follows:

    The processor has attempted to execute an instruction that makes illegal use of the EPSR register. When this bit is set, the PC value stacked for the exception return points to the instruction that attempted the illegal use of the Execution Program Status Register (EPSR) register.

    I attempted to read up on the EPSR and found this:

    EPSR contains the Thumb state bit and the execution state bits for the If-Then (IT) instruction or the Interruptible-Continuable Instruction (ICI) field for an interrupted load multiple or store multiple instruction. Attempts to read the EPSR directly through application software using the MSR instruction always return zero. Attempts to write the EPSR using the MSR instruction in application software are always ignored. Fault handlers can examine the EPSR value in the stacked PSR to determine the operation that faulted (see “Exception Entry and Return” on page 108).

    I had a hard time understanding what this meant but I thought I'd try read the EPSR value and see if that gave me any insight. However, I could find no EPSR, or PSR register in the Symbols>Special Functions Register window of the Keil Debugger.

    I'm still confused unfortunately. Amit, have you seen this Invalid State Usage Fault before, and do you know how I can read the EPSR value to continue figuring out the problem?

  • Hi , was wondering if you'd had a chance to take a look into this. Would be super grateful for some guidance.

  • Hello Zero_PD,

    Yes. I did. And of the investigation led to me the fact it may be a Stack Corruption/Overflow. Can you increase the increase the stack size?

    If that does not help, the next thing to do is to bring the debug as close as possible to the execution code which causes the Fault to occur. Not a trivial task but still necessary.

    Regards
    Amit
  • Thanks Amit. I had to do some reading up to understand what you meant by Stack. The only stack I'm familiar with is the FIFO stack for UART communication. After some digging, I found an old thread where (you!) explained how to change the stack in the startup_rvmdk file. In the morning, I'll try increasing the stack size to 0x400 and seeing if that makes a difference. I'll report back.

    I have brought the debug to the lowest line of code that causes the Fault to occur. Is that what you meant by "as close as possible to the execution code"? It is a line of code that sends a read command via I2C to the bno055 chip I'm using. The odd thing is that line of code is called many times before in my code without causing a fault. Why does this particular instance cause it?
  • Hello Zero_PD

    Had it been a precise bus fault, it would have failed the first time around. The issue with most other fault is that they have an indirect cause and hence makes it more difficult to isolate

    Regards
    Amit