This thread has been locked.

If you have a related question, please click the "Ask a related question" button in the top right corner. The newly created question will be automatically linked to this question.

Help to debug "corrupted" variable

Other Parts Discussed in Thread: EK-TM4C123GXL, SEGGER

Gents,

I have no experience to deal with this one, and it seems that my resources are gone... maybe some of you can suggest an approach:

On a TM4C123 project using CCS, there a variable that appears to be "corrupted" somewhere else. Details:

- It is a public variable declared on the main_project.c: int64_t enc_pulsos_acumulados;

- It's value is only changed in one and only one location. It is behaving as expected, accumulating "small values" such as 805, 806... Suddenly, the high bits of this int64 all become FF FF FF FF...

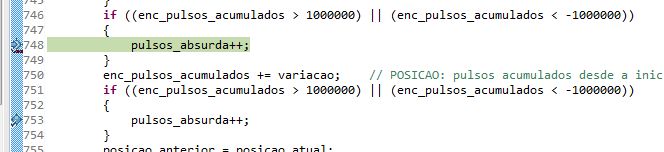
- I added a couple of tests before and after the only location where it is changed, and it shows that actually this corruption comes "somewhere else". Piece of code posted below (pasted as an image just to better illustrate where the breakpoint stoped.

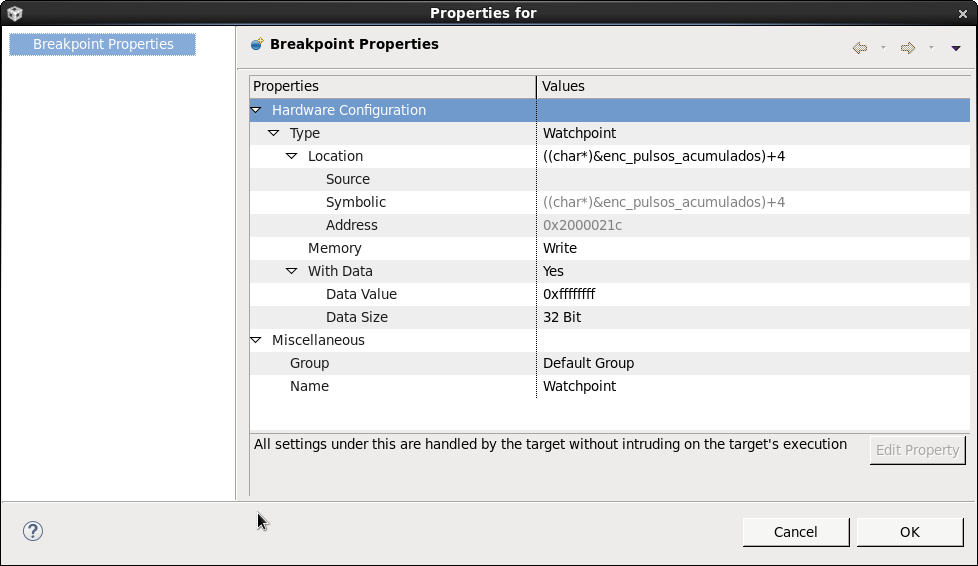
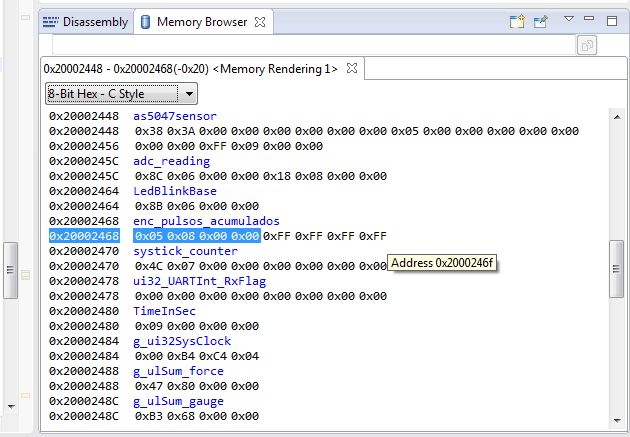
I also looked at the memory location to check if eventually there was an array or something nearby, but it does not seem to be the case (image below).

I tripled checked and there is no other attribution to this variable elsewhere.

Any suggestions as how to debug and find what's happening?

Thanks!!!

  • I've quick/dirty comment:

    • those high bits all @ "FF" have the scent of "subtraction beyond zero" - rather than "accumulation!"   Is that possible?
    • suspect that (some) signal is being injected - and being accumulated.   What happens when you more precisely control this signal?   Is it (even remotely) possible that your signal input becomes, "out of spec" and/or "floats" - which may account for so drastic an "accumulation?"   I'm suggesting that you "feed your input" with a very controllable - and known - and proper (voltage & rise/fall times) signal - and then test/observe that.
    • Pro IDEs (Keil, IAR) enable you to "watch" a selected variable - capture & chart each/every variable access
    • I note that you test - via, "pulsos_absurda" (past had "friend" w/that name) for such "illegal" activity.   I'd do precisely the same - but (now) via far more controlled inputs.
    • you don't state the number of boards which "repeat" this behavior.   Single board anomaly drives guys like me Krazy!
    • might RF or high currents be the cause?   How have you checked?

    Perhaps "not so bad" for quick/dirty...

  • Given that the source shows a check for negative values, I wouldn't place any significance on the high bytes being ff other than indicating negative.

    One other supplementary technique is to log every change the affected value and the values used to calculate it when it is changed. I. E. If the change is done by adding another value to it, then log that value as well. There's a reasonable chance the unexpected behaviour is actually introduced earlier.

    Robert
  • Is single-stepping (and watching the variable) possible in this case? Just in case your toolchain / debugger can't properly watch and break on data changes.

    Have you any DMA configured ? If so, make sure you never define a stack address as DMA target - that could cause effects as you observed. And since the effect seems asynchronous, I would review interrupt code and stack usage in general.

  • Thanks for the comments. It's not hard to solve it another way (eventually it will magically get solved when I detach this function from the main file into an external library, and replace direct variables by pointers), but I don't like to waste the opportunity of learning. At least we might come up with a check list of ideas for such cases:

    - Single-step and watch the variable. Not too good for this particular case where we read a sensor at ~400Hz and the error happens randomly, but likely to be the first debug tatic.

    - Checking for DMA's (this project does not use them, however)

    - Log every change of the affected value (does CCS allow for that? - this one I never used... I even found some sort of breakpoint whose name suggests that's what it does, but I did not go ahead on that path so far).

    - Add error counters when the involved variables cross some limits (this was done for current debug, and interesting enough, none of the variables before the problematic one ever crossed their lines!) - so not only CB's friend pulsos_aburda (was he Latim?), but also threshold-shields for all of his other friends.

    There are check-shields both after and before the line where bad-variable gets modified, and the breakpoint flags always before - meaning that the dirt hit the fan outside the function... And here's the checklist I used to verify nothing can change it elsewhere:

    - Obvious F3 search for the variable name in all files of the project

    - Looked for memcpy or any other direct memory modifier

    - Verified the memory location and inspected the neighbors, in case there were any arrays nearby accidently overwelcoming their declared size.

    Again it was not the case, but at least the post might come in handy for others in the future.

    - Single board problem???? In cb's perfect world, test batch is 10 pieces? On my other extreme case, the boards were made and are to be used in South America, and I'm in Europe developing code having a single and only one unique singular example of such. If I burn, touch the wrong traces,  there will be a delay of a week until another board comes in...  Is that the wrong way of doing it??? Oh yeah! Get's worse: some of the other boards are already on the customer's equipment in real application situation! :) living on the edge...

    void Encoders_Read()
    {
    	static int32_t	position_previous = 0;
    	static int32_t	offlimits_displacement = 0;
    	static int32_t	offlimits_position = 0;
    	static int32_t	offlimits_accupulses = 0;
    	int32_t			displacement_pulses = 0;
    	int32_t			position_current;
    	// macro STATUS_ENC_RES defined as 16384
    
    	AS5047PRead(AS5047_ANGLEUNC, &as5047sensor);
    	position_current = as5047sensor.angleunc;
    
    	if (!(position_current & AS5047_BADVALUE))		// Proceed only if BADVALUE bit is clear
    	{
    		if (position_current > STATUS_ENC_RES || position_current < (-STATUS_ENC_RES))
    		{
    			offlimits_position++;
    		}
    		displacement_pulses = position_current - position_previous;   // Simplest case: displacement is just the difference between current and previous
    		if ((displacement_pulses > 0 ? displacement_pulses : -displacement_pulses) >= (STATUS_ENC_RES/2))	// Check for more than half a turn
    		{
    			displacement_pulses = (displacement_pulses > 0 ? displacement_pulses - STATUS_ENC_RES : displacement_pulses + STATUS_ENC_RES);
    		}
    		if (displacement_pulses > (STATUS_ENC_RES/2) || displacement_pulses < (-STATUS_ENC_RES/2))	// Debug against crazy displacements (never happened)
    		{
    			offlimits_displacement++;
    		}
    		if ((g_encoder_accupulses > 1000000) || (g_encoder_accupulses < -1000000)) // Debug for huge values before modification
    		{
    			offlimits_accupulses++;
    		}
    		g_encoder_accupulses += displacement_pulses;		    // Adds calculated displacement to the accumulated number of encoder pulses
    		if ((g_encoder_accupulses > 1000000) || (g_encoder_accupulses < -1000000)) // Debug for huge values after adding
    		{
    			offlimits_accupulses++;
    		}
    		position_previous = position_current;
    	}
    }
    

  • Bruno Saraiva said:
    On a TM4C123 project using CCS, there a variable that appears to be "corrupted" somewhere else.

    Since the corruption occurs when the 32 most significant bits get set to all ones try setting a Hardware Watchpoint in the CCS debugger with the following settings:

    [When a Hardware Watchpoint is created, the "With Data" property is No by default, so you have to right-click on the watchpoint in the Breakpoints view and change the Watchpoint properties to select "With Data" as Yes and set the data value to stop on. By setting "With Data" to yes the watchpoint will only trigger when the corrupted data is written]

    That will trigger a breakpoint when the CPU sets the most significant bits of enc_pulsos_acumulados to all ones. On the assumption that the corruption is coming from a CPU write, that should identify where in the software the write is coming from. Note that the breakpoint might trigger several instructions after the actual write, so once has halted the Program Counter shown in the debugger might have advanced a few instruction on from the actual instruction which wrote the "corrupted" value.

    24/2/2016 14:44: Edited to show the correct way of specifying the upper 32-bits of a 64-bit variable.

  • - Single-step and watch the variable. Not too good for this particular case where we read a sensor at ~400Hz and the error happens randomly, but likely to be the first debug tatic.

    For sure, single-stepping is not really an efficient method for (seemingly) random issues.

    - Checking for DMA's (this project does not use them, however)

    DMA was a guess of mine. Since neither DMA is used, nor are the variables affected are placed on the stack, I would rule that out.

    A data watchpoint (like Chester suggested in his post) seems the best method in this case. Free toolchains often have some "deficiencies" in regard to advanced debugging support.

    And, in support of cb1's suggestion, reproducing the issue on other boards (or at least one) could tell you if the issue is related to hardware - or not.

    Have you measured the average / peak interrupt load, and the maximum stack usage ? The nature of the event supposes it is related to asynchronous events, most probably interrupts. Perhaps a 'rare' interference of two interrupts. Or indirectly via the stack usage - all the toolchains/IDEs I know fail to properly estimate the effect of interrupts on stack usage.

    Or do you use calculated array indices or pointer offsets anywhere - perhaps in an interrupt ?

  • Bruno Saraiva said:
    In cb's perfect world, test batch is 10 pieces

    May be - but usually 3 - 5 boards are produced & assembled - enabling, "A-B-C" comparison testing.   Further - multiple such boards enable more "in-depth" test/verification of (different) software approaches - running simultaneously - each on its (own) board) - something (never) achievable via, "Single Board Production!"   When, "Time is of the essence" - such parallel testing harvests results far faster than crude, "serial" testing of (just) one single board!  Such testing has never been noted/described as, "perfect" (poster's word) yet far exceeds the results "teased" from (just) one, lone board!  (clearly imperfect!)

    There exists a "continuum" of worlds - Perfect proves (usually) unreachable yet (some) thought/planning (i.e. building several pcbs - rather than just one) spectacularly, "Speeds, Eases & Enhances Test/Verify" - thus is very widely adopted!

    You signal "dislike" for the "presenter" - yet the methods & approaches listed have proved unusually sound & effective - your attack fails to so note...

  • Of course testing with another board (the more the better, never know if 2 or more are broken) is the best way possible.
    Of course you can say the software and hardware is good to go with one if it works - but if the test fails was it the software or the hardware? (many headaches with this dilema for me, usually I don't have a duplicated system for projects with more pieces).


    With one board you can use a variable watchpoint like chester suggested <- best approach IMO.
    These are just maybes to cut some unlikely culprits
    You can also try to use lm flasher to completely erase the flash and blank check (just in case, I don't know).
    Try to for example increase stack size (maybe).
    You could turn of the optimizations if you didn't already though for this particular problem I doubt that's the problem since the symbol is there.
  • By logging I mean something perhaps both simpler and more complex. The best version is to capture all the variables that are used to calculate the value and the value every time you assign a value to it. Capture this to a ring buffer until your result is wrong then stop collecting. You can read the buffer at your leisure later. My past experience is that there is that what your calculation is and what you think it is are not the same.

    Robert

  • Speaking of which, I don't see where you're modifying the variable in question. All of the variables you modify appear to have function scope.

    Robert
  • But the corrupted variable (if interpreting the image in the first post correctly) is declared as "static", and as such lives with the global variables, and not on the stack.

  • Robert Adsett72 said:
    Speaking of which, I don't see where you're modifying the variable in question. All of the variables you modify appear to have function scope.

    There is actually one global variable, which is exactly the one bugging me:

    g_encoder_accupulses += displacement_pulses;+= displacement_pulses;

    Purposedly, everything else indeed has function scope, and we don't have to worry about them outside. So the mistery remains: how can suddenly g_encoder_accupulses have a huge negative value? The threshold shield flags inside the function, before the modification (in other words, it leaves the function with a good value, and when the function is next called, the variable shows corrupted values, as if it had been modified somewhere else).

    The suggestions above are good for a general situation where one is trying to find where his own code destroys the variable. They don't seem to apply when the suspicion is memory corruption. I could log 1000 previous values inside a ring buffer, and all I would see it that this variable suddenly goes from an expected value into something like -4987654321000 with no apparent reason... :(

    As a matter of fact, the problem is in fact solved when I dettached the function from the main file to a separate library file. The variable is now passed to the function as a pointer, and it has not gotten corrupted for the past 40 hours of bench test... Everything else remains unchanged. The play here, again, seems to find out what makes a memory section suddenly become FF FF FF FF away from the C programming... 

  • Bruno Saraiva said:
    he play here, again, seems to find out what makes a memory section suddenly become FF FF FF FF away from the C programming...

    The reason I suggested using a Hardware Watchpoint to try and trap the source of the memory becoming FF FF FF FF is that the Hardware Watchpoint makes use of the Cortex-M4 Data Watchpoint and Trace Unit (DWT) to watch CPU writes. i.e. is independent of the C code, and allows the program to run at full speed (in case the corruption is timing sensitive).

    Did you have a chance to try the Hardware Watchpoint. If so, did the Hardware Watchpoint trigger when the memory section became FF FF FF FF or not?

    That is to try and determine if the corruption comes from a CPU write or not. If it is coming from a CPU write the next step is to determine if the cause is a software error.

    Bruno Saraiva said:
    I could log 1000 previous values inside a ring buffer, and all I would see it that this variable suddenly goes from an expected value into something like -4987654321000 with no apparent reason... :(

    If your debugger supports SWO trace, then can potentially use SWO trace to investigate the program flow up to the point of the corruption.

  • But that's not the variable you highlight.

    That logging suggestion is for covering the case where either your calculation is incorrect or your combination of inputs turn out to be unexpected. You do not appear to have evidence otherwise currently.

    Also that memory area will become all F for any negative number, negative numbers appear to be routine given what you've shown of the code.

    Robert
  • Actually you need a slightly more sophisticated watchpoint.

    Break for any write to location x1 to x2 when the instruction address is not in the range y3 to y4. I have needed this capability in the past but not on an ARM Cortex. It's unclear to me if the core supports even one of this kind of memory watchpoint. A real ICE would but AFAIK there are no such things for the cortex cores and if they exist they are probably prohibitively expensive since the builtin support covers so much already.

    The alternative may be hours of trace collection, I've done that too when the ICE couldn't provide a sufficiently sophisticated breakpoint

    Robert
  • Robert Adsett72 said:
    Actually you need a slightly more sophisticated watchpoint.

    The watchpoint involves an address compare and a data compare, since watches for a specific data value being written to a specific variable address.

    I created the following test program:

    /*
     * main.c
     */
    
    #include <stdint.h>
    #include <stdlib.h>
    
    int64_t enc_pulsos_acumulados;
    
    static void generate_variable_corruption ()
    {
        enc_pulsos_acumulados = -rand ();
    }
    
    int main(void)
    {
        uint64_t iterations = 0;
    
        for (;;)
        {
            const int input = rand();
    
            if ((iterations >= (1 << 24)) && (input == 12345))
            {
                generate_variable_corruption ();
            }
            else
            {
                enc_pulsos_acumulados = input;
                iterations++;
            }
        }
    	
    	return 0;
    }
    

    This test involves writing mainly positive values to a 64-bit variable, and after several million iterations writing a negative value.

    The test ran on an a EK-TM4C123GXL using the built-in Stellaris ICDI. CCS 6.1 was used to set the following hardware watchpoint which detects a write of FF FF FF FF to the most significant 32-bits of the 64-bit variable enc_pulsos_acumulados:

    The program was run, and the CCS Expressions view was set to display a continuous refresh of the enc_pulsos_acumulados variable which showed "good" positive sample values while the target was running for several 10s of seconds. The view when the watchpoint occurred was:

    This showed the watchpoint has triggered after the negative write to the enc_pulsos_acumulados variable. Note that the current Program Counter location is in main, since the program executed a few instructions after the write before the target halted.

    This demonstrates a watchpoint using an address and data compare without requiring an expensive emulator, as uses the built-in Cortex-M4 DWT.

  • Yes Chester, but from the code and other discussion presented small negative values are not a problems. The problem shows as a large negative value. Also, I suspect a large positive value would also be an issue. So the high order trigger is not of much use if I understand the situation correctly.

    Robert
  • Chester Gillon said:
    Trace Unit (DWT) to watch CPU writes. i.e. is independent of the C code, and allows the program to run at full speed (in case the corruption is timing sensitive).

    While we do not use this particular MCU - and I believe that Chester is "relaying" info provided elsewhere (re: run @ full speed) several of my firm's clients report that, "NOT to be - at all times & conditions - the case!"   These firms are skilled, very well equipped - I'd at least admit their findings to this "brew."   In addition - iirc - ARM has advised that, "Not ALL" data may be (always) collected via DWT (i.e. - there are performance limitations!)

    Further - might the, "method of arrival" of the "illegal value" under Chester's test raise some flag?   If that "method" differs - in any way whatsoever - from poster's use case - is this HW Watch test (fully) valid?   Recall that when (attempting) to measure the charge upon an electron - we must be extremely careful to NOT disturb or impact the electron!

    To my mind we have moved from, "Pulsos_absurda" to, "Effortos_absurda."   And - notable by its absence - is, "Gratitudos" - which proves (never) absurda!

  • Robert Adsett72 said:
    The problem shows as a large negative value. Also, I suspect a large positive value would also be an issue. So the high order trigger is not of much use if I understand the situation correctly.

    I was focusing too much on the initial post which said the problem occurred when the most significant bytes got set to FF FF FF FF. As you have clarified, the code fragments allow for small negative values.

    The Cortex-M4 DWT Data value comparison functions only allow a comparison against a specific value, and so don't allow for testing of "out of range" values.

    Bruno Saraiva said:
    There are check-shields both after and before the line where bad-variable gets modified, and the breakpoint flags always before - meaning that the dirt hit the fan outside the function.

    The DWT registers are memory mapped, which I think means the program running in the Cortex-M4 could enable/disable watchpoints on the fly.

    i.e. if a global variable is suspected of getting corrupted by some unknown code, then it may be possible to set a DWT watchpoint for any write to the address of the variable and disable the watchpoint just before the expected function updates the variable, and then re-enable the watchpoint after the expected function has updated the variable.

    From a quick search of a CCS 6.1 installation, there are some include files which define the DWT registers, but haven't yet attempted to create a test example.

  • That's a point cb1, maybe Chester knows the answer.

    Does the the internal watchpoint system capture all memory accesses or just those by the core?

    Robert
  • cb1_mobile said:
    While we do not use this particular MCU - and I believe that Chester is "relaying" info provided elsewhere (re: run @ full speed) several of my firm's clients report that, "NOT to be - at all times & conditions - the case!"

    To be honest, I haven't created a test to see if the use of DWT data watchpoints impacts the target performance. I based my "full speed" statement upon the "All settings under this are handled by the target without intruding on the target's execution" which appears on the CCS hardware watchpoint properties window.

    cb1_mobile said:
    In addition - iirc - ARM has advised that, "Not ALL" data may be (always) collected via DWT (i.e. - there are performance limitations!)

    From reading the DWT section of the ARM v7-M Architecture Reference Manual (ARM DDI 0403D) I can see that if the DWT is generating trace packets, that might not be able to output all the trace packets depending upon the available bandwidth to output trace packets.

    The DWT use case for this problem is making the DWT halt execution after a watchpoint is triggered, rather than using the DWT to collect data.

  • Chester Gillon said:
    The DWT use case for this problem is making the DWT halt execution after a watchpoint is triggered, rather than using the DWT to collect data.

    I'm not so sure that statement escapes the weakness previously noted.   Especially so under the banner of CCS.  

    Data must be first captured - then tested/compared.    While you are not technically "collecting" - I very much doubt that the "test/compare" function exacts NO Penalty (speed-wise) and is "universal" in its (successful) capture of ALL data...

  • Robert Adsett72 said:
    Does the the internal watchpoint system capture all memory accesses or just those by the core?

    A TM4C123 datasheet shows the following CPU block diagram:

    Other block diagrams show that the DMA and SRAM are connected to the "System bus" of the CPU, via a different bus matrix external to the CPU. While I haven't tested it, I believe this means the DWT internal watchpoint system will only be able to capture memory accesses by the core.

  • Robert Adsett72 said:
    Break for any write to location x1 to x2 when the instruction address is not in the range y3 to y4. I have needed this capability in the past but not on an ARM Cortex. It's unclear to me if the core supports even one of this kind of memory watchpoint.

    The ARM documentation for the DWT address comparison functions shows that a DWT Address Comparator can Generate Data trace PC value and data value packets on a write to a monitored address. In theory if those trace packets were routed though SWO the debugger in the host could interpret the PC values which are writing to the variable, and cause the target to halt once an out of range data value and/or incorrect PC value was seen. Of course, dependent upon the rate of writes to the variable some trace packets (and thus writes) might be missed.

    However, my attempt to set up such capability have so far failed:

    1) In CCS 6.1 using the SWO trace on an XDS110 I can get Data Variable Tracing to show the the variable address and data value, but can't see a CCS option to configure the PC value and data value.

    2) Using IAR 7.40 with a J-Link configured a Data Log to trace the PC value and data value for a write to a variable, but the trace log was empty. Not sure if this is a bug or I am not using the tool correctly.

  • Chester Gillon said:
    Using IAR 7.40 with a J-Link configured a Data Log to trace the PC value and data value for a write to a variable

    Suspect this approach (pro IDE) greatly raises the odds of success!   One assumes the "J-Link" is, "official" and has "latest/greatest" updates.   Segger site may offer details - firm/I have never attempted.

    Poster Chester has gone above/beyond - yet I hold in the belief that DWT may not always prove, "all encompassing."