This thread has been locked.

If you have a related question, please click the "Ask a related question" button in the top right corner. The newly created question will be automatically linked to this question.

Unable to view SRAM locations in debug

Guru 55913 points
Other Parts Discussed in Thread: TM4C1294NCPDT

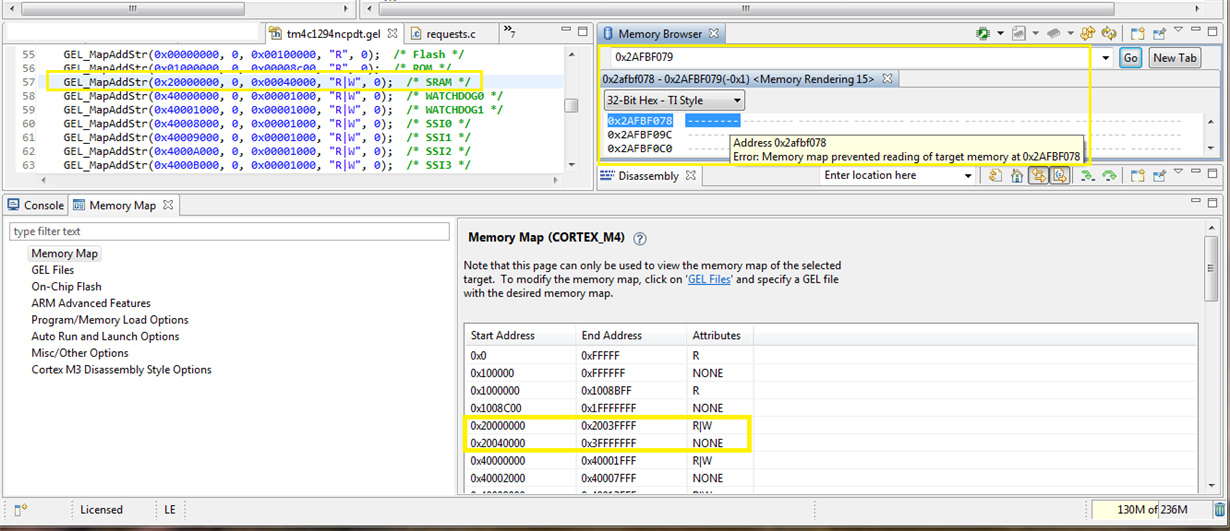
TM4c1294ncpdt Gel file shows the SRAM range as per memory map in datasheet. Notice the R/W attribute is NONE for the second part of SRAM range. Consequently this is the same precise memory location (0x2AFBF079) that persistently coincides with random bus fault 11 status. Have changed the project compiler to 5.14 and set optimization in the middle to see if that helps. Also getting same Memory Browser error if the target is running or paused.

See what I mean and thanks for looking under the hood!

  • Hello BP101,

    The maximum SRAM is 256KB. So the range is 0x2000.0000 to 0x2003.FFFC. The value 0x2AFBF079 in the NVIC Fault Register would be telling that there is an issue because of which it goes to this location causing the bus fault. Recompile the project with optimization switched off and then step to the point after having isolated the function where it is being caused.

    Regards
    Amit
  • Amit,

    My June 18/14 Revision D data sheet page 107 table 2-5 shows SRAM range 0x2000.0000 - 0x3FFF.FFFF.
  • Ok now see table 2-4 Bit banded is memory map 0x2000.0000 - 0x2006.FFFF and Gel shows end is - 0x2003.FFFF.

  • Accordingly the fault address 0x2AFB.F079 falls in table 204 occurring in Reserved memory range 0x2235.0000 - 0x3FFF.FFFF. How to track that seems impossible.

    Oddly strange is table 2-6 bit banding memory region End is 0x2006.FFFF is roughly 458kb. Perhaps table 2-4 is also a memory map should be 0x2003.FFFF?

  • Hello BP101,

    As I mentioned earlier, the issue may be due to some other fault, causing the CPU to access this location. The first thing to try is to increase stack and heap size (latter if you are using dynamic memory allocation).

    If that does not help, then turn off compiler optimization and debug to the function, whose execution is causing the bus fault. Once there step debug the function to find the offending code and see what is happening in dissasembly.

    Regards
    Amit
  • Hi Amit,
    Interesting without any optimizations set the application kept faulting during USB initialization. With optimization (Registers only) the application at least will execute and Runs in debug.

    Does datasheet suggest what reserved memory area is used for or by what peripherals?
    I suspect EMAC0 TX/RX controller FIFO's live there, perhaps too USB0 FIFO's.
  • Hello BP101,

    I doubt it. It may be a Bit Banded flag. What point during initialization does it fail?

    Regards
    Amit
  • Hi Amit,

    Well if I add a short Delay after sending data to EMAC0 before raising the TX flag true the fault may occur 100000's of seconds versus 100's of seconds later. It don't matter how the EMAC DMA is configured IE: Mix/Fixed burst rates, TX priority, 4,8,16 the fault eventually raises but much sooner without the added delay. Some in forum have suggested the add Delay is not a good solution but my find is internet COMMS are strange animals......

     No registers optimization, LP Immediately faults middle of displaying the Bulk USB client initialization message which is after initialization of ports, timers, PWM, ADC peripherals. Can you tell me what lives at Reserved memory address (0x2AFB.F079) ?? since it is reserved we have no access to even DEBUG it and see the contents.

    That said we have to find a solution for what ever is using Reserve space but without knowing what is reserved for...... 

    Bulk USB device is last set up before connection is made to Exosite. Added clock lines found Host/Hub to bulk USB device initialization - didn't help.

        //
        // Tell the USB library the CPU clock and the PLL frequency.
        //
        USBOTGFeatureSet(0, USBLIB_FEATURE_CPUCLK, &ui32SysClock);
        USBOTGFeatureSet(0, USBLIB_FEATURE_USBPLL, &ui32PLLRate);

  • Hello BP101,

    I am not sure what is there at 0x2AFBF079. If this is not bit banded access, then for sure a direct memory access is causing it. As I said, earlier, the USB library needs to be debugged to see where the bus fault access is being made? Did you remove the ethernet access and just kept USB and see if it is working?

    Regards
    Amit
  • Hi Amit,

    Odd thing is USB bus fault does not occur when the most basic register optimization is enabled. The problem with trying to debug USB fault is we have to single step the fault. Do we really need to do that or can we get a good debug session with register optimization level for any Reserve memory faults. NVIC precise landed on 0x2AFBF079  several times but we don't know how to track Reserve memory space other than by trail and error by adding Delays, Boolean flags, etc..

    Note worthy is the original HWREGBITW (RX/TX) blocking flags several instruction times long now exist as single instruction high speed Boolean switches. That rolling DHCP event flag was unnecessarily expending 1000's of machine cycles, corrected via single && switch.  BTW that rolling DHCP event call at times locked up our wireless routers DHCP server. We really didn't need to hold off the DHCP calls in LWIP timer call since this block flag takes care of the rolling Exo_Hal DHCP events as well.

    Here is the fix (eth_client_lwip.c) / LWIPHostTimerHandler(void):

        }
        else if((g_sEnet.eState == iEthDHCPWait) && (HWREGBITW(&g_sEnet.ui32Flags, FLAG_DHCP_STARTED) == 0)) //BP 4.9.2015 Stop rolling DHCP events.
        {
         

  • Hello BP101,

    So potential problem may be memory allocation. I have seen similar issue when using calloc/free memory allocation functions. There is no way other than step debug to see what is happening.

    Regards
    Amit
  • Hi Amit,

    SRAM access timing seems to be more the issue we are seeing and that my friend in my opinion is silicon related. If we knew what the SRAM maximum CAS/RAS/EN timing was then we might have a basis for a broader discussion. Agree this is not DRAM but dang it sure behaves like such.
  • Hello BP101,

    There is no CAS/RAS/EN for SRAM. It is a single cycle access path. The data for an address is sent on the clock cycle after the address and control signals are sampled by the memory controller.

    Regards
    Amit
  • Friday night reply to Amit,
    I was being factious about SRAM timing info but the spa is now 58 degrees after filling with fresh water --- soon 102F. Please come visit and see what is going on, next vacation will be great - best roller coaster ride ever at near by park! Call any time soon Amit you deserve it!
  • Same goes for CB1 -- we all deserve a vacation on TI for all this hard work ----IOT will save the Earth for future generations!
    My daughter reminds me Kings Island is a blast!!!
  • Always diplomatic - Cb1/staff simply (cherish) vendor's (many) "leaky mugs" and "low thread count T-shirts."    

    Vacation in OH (2nd time proposed, today (see Attila) - go figure) as likely (& desirable) as (facetious), "RAS/CAS" posting...  

    We may consider (when) Johnny Football returns...  (but only at/around 50 Yd Line Field Box & non-vendor (i.e. leak-free) mugs...)

  • Hi Amit,

    For CB1 my rebellious attempt (factious) intended humor not intended as spell check frater. Course we are aware SRAM does not use column/row refresh cycles- hence the uprising posts. The random bus faults (11) seem integral to the GEL file SRAM R/W address range mention several posts above.

    Referring back to the datasheet memory map page 103 table 2-4 seems in conflict (useable SRAM) GEL table end address (0x2004.0000). Myself prudently checking said SRAM R/W range several times in the past, discover it incudes protected regions in EMAC0 DMA pBuf tests (Safe) memory space (>=2000.0000 && <= 0x2007.0000) abstraction layer memory constraints. Seemingly disaster occurs anytime pBufs enter address space above 2004.xxx).

    Luck would have it Transport pBufs use considerable more bytes for http header allocation than RAW pBufs. It is not documented LWIP 1.4.1 higher up layers append extra bytes to http headers of existing DMA R/W descriptor pBufs. Unless we print LWIP debug stats after LWIP initialization that would not be apparent and slower COMS exacerbate the issue of HEAP space use in excess pBufs entering protected memory space. The LWIP HEAP space has not risen above 8020 max bytes since Friday night and now hangs near 1080 used bytes.

    Todays Making that run MCM pickup on a 4 port USB HUB. :-)

  • Hello BP101,

    With respect to 256KB address space, the SRAM address space must be defined as 0x2000.0000 to 0x2003.FFFC.

    Regards
    Amit
  • Hi Amit,

    Will be sure to lower that last address a bit more 0x2003.FFFC = 262140KB.
    Seems I was not the only one fooled by memory MAP table 2.4 typo. At least it seems an error in table 2.4, the 6 should actually be a 3. That has been messing with pBuf memory guard band for quite some time. Never past had GEL file open in CCS to see why but changing 0x0004.0000 to 0x0006.FFFF or 0x0007.0000 then it becomes very clear something ain't right.

    Thanks -- this find is a huge boost!