This thread has been locked.

If you have a related question, please click the "Ask a related question" button in the top right corner. The newly created question will be automatically linked to this question.

CCS/TM4C129ENCPDT: Bus fault error at reserve addresses

Part Number: TM4C129ENCPDT

Tool/software: Code Composer Studio

Hi everyone

My board uses TM4C129ENCPT, it connects to a device via UART(rs485 9 bits mode, UART0 for receiving data, UART3 for transmitting data ) and a website via ethernet.

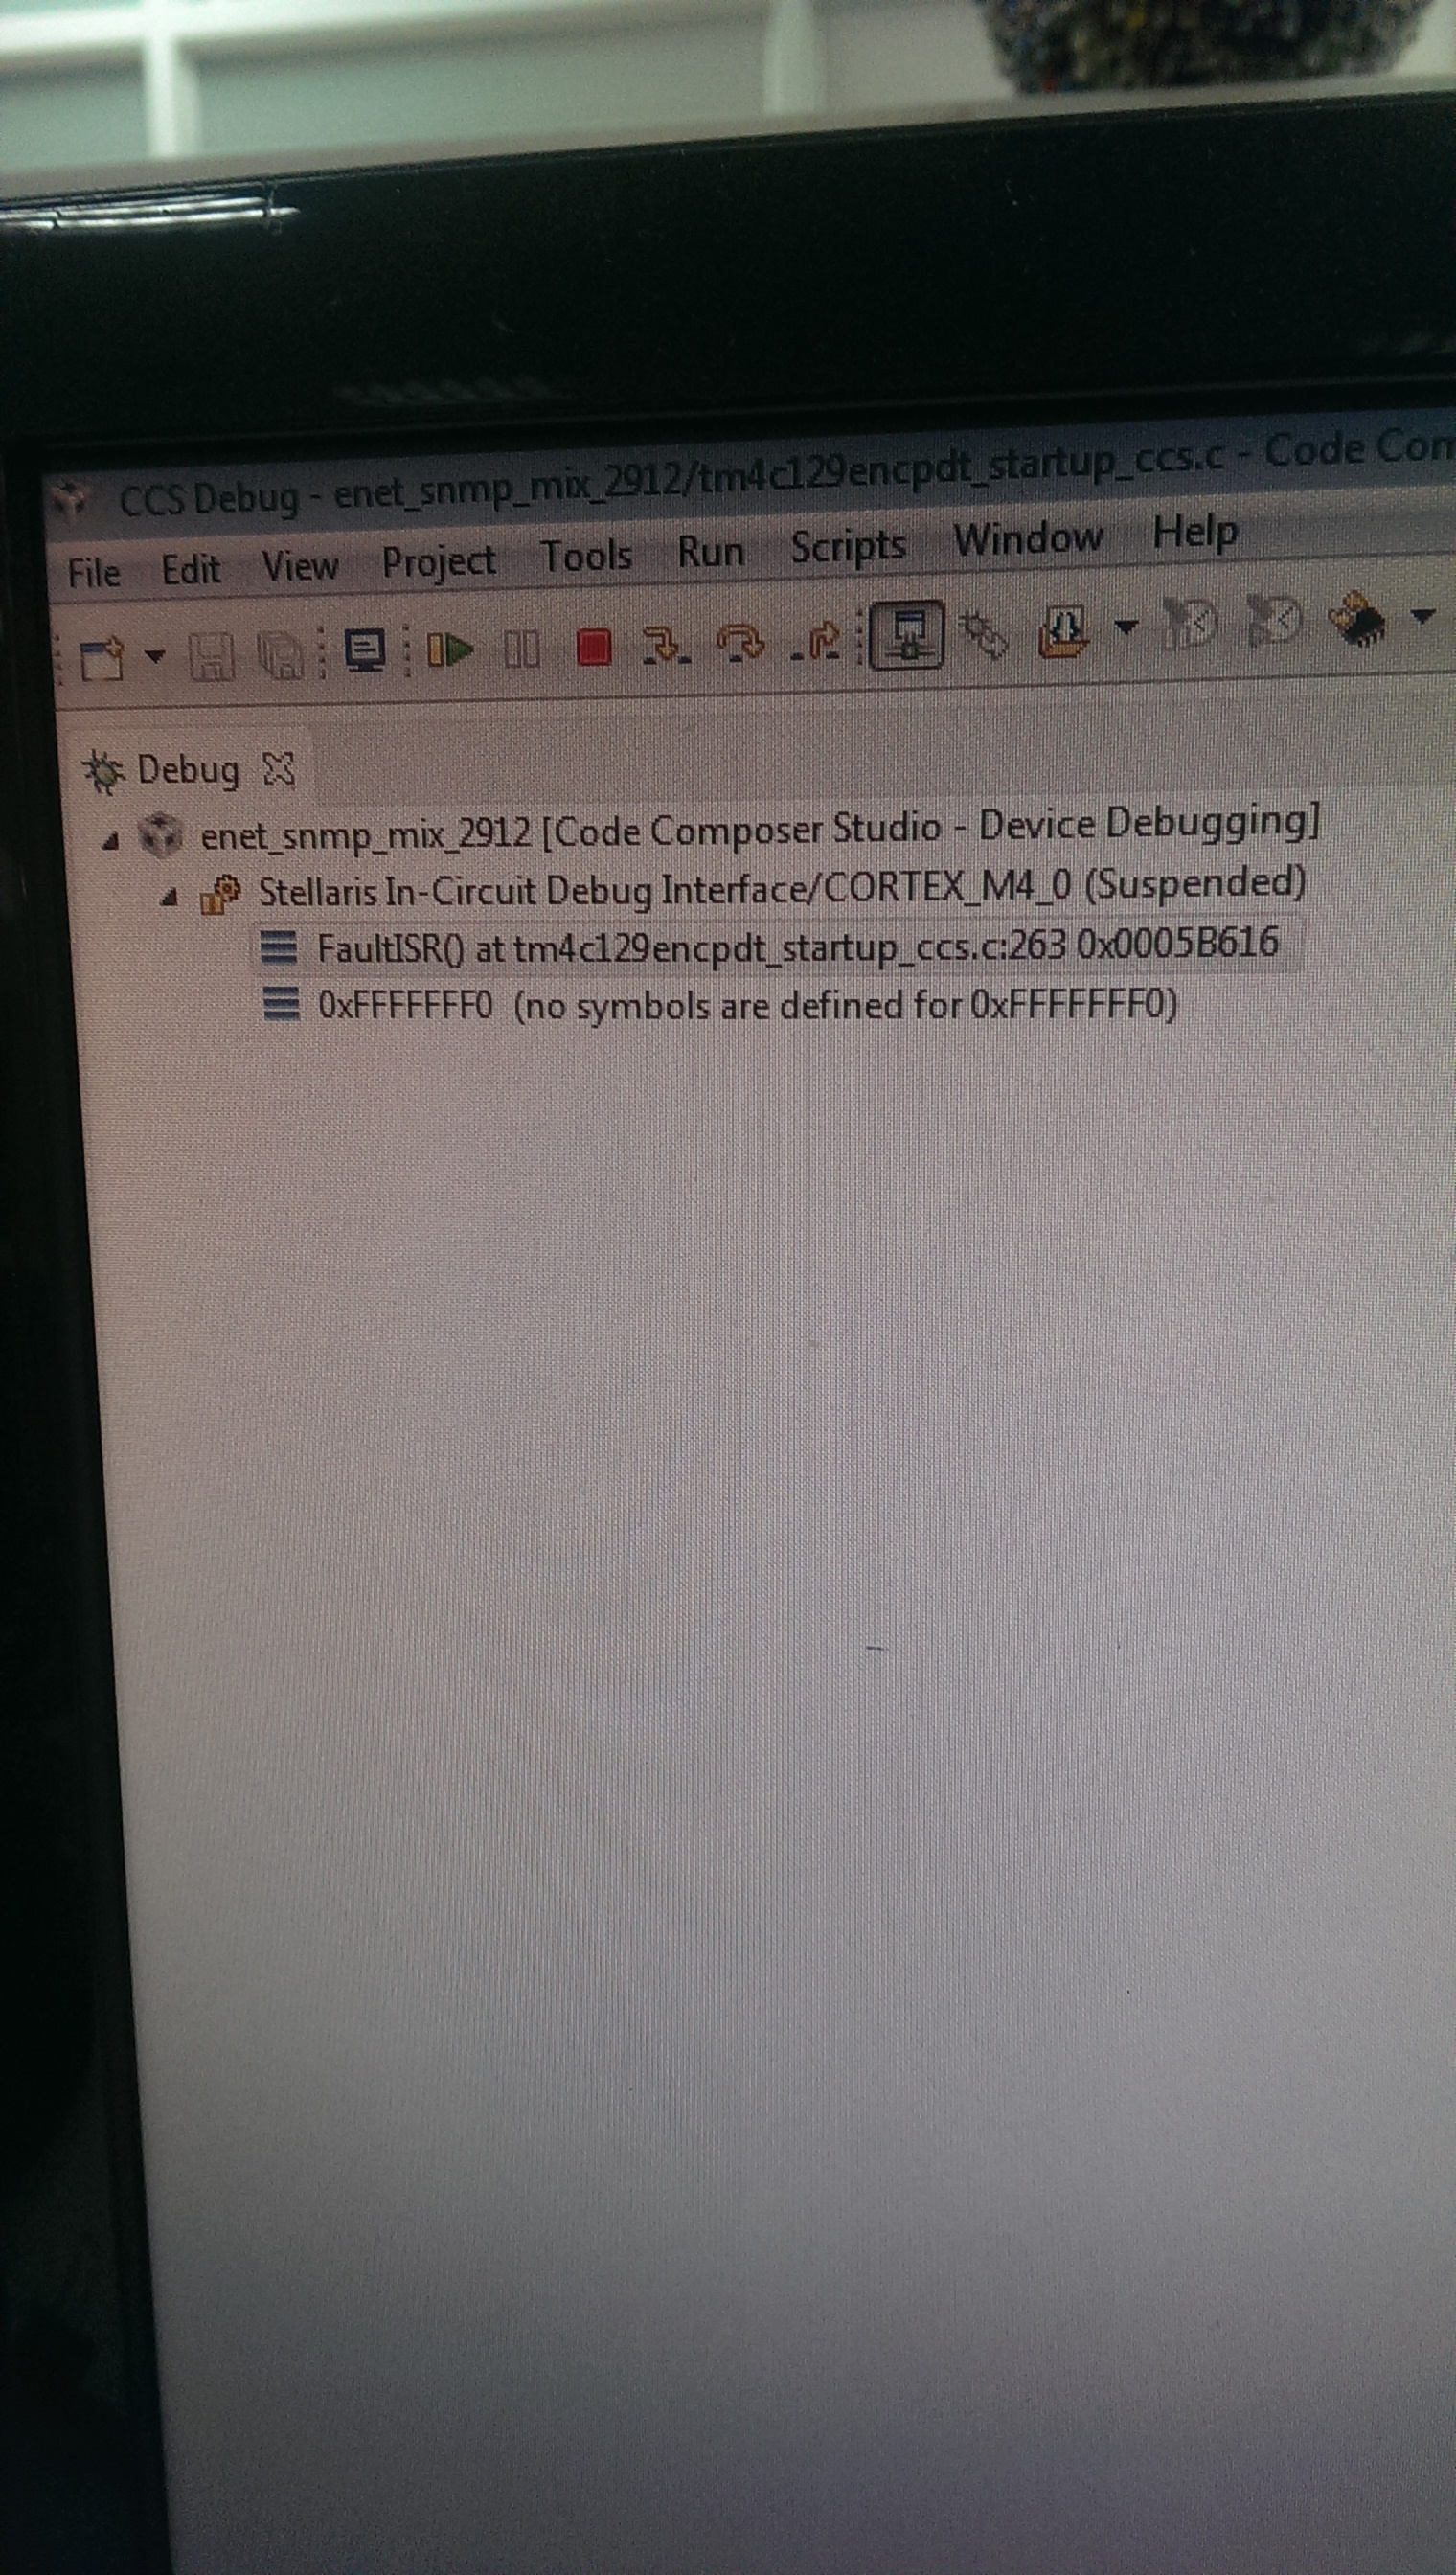
The board gets the information from the website and send it to the device via uart. Sometimes when I set the information from the website my code run into FaultISR().

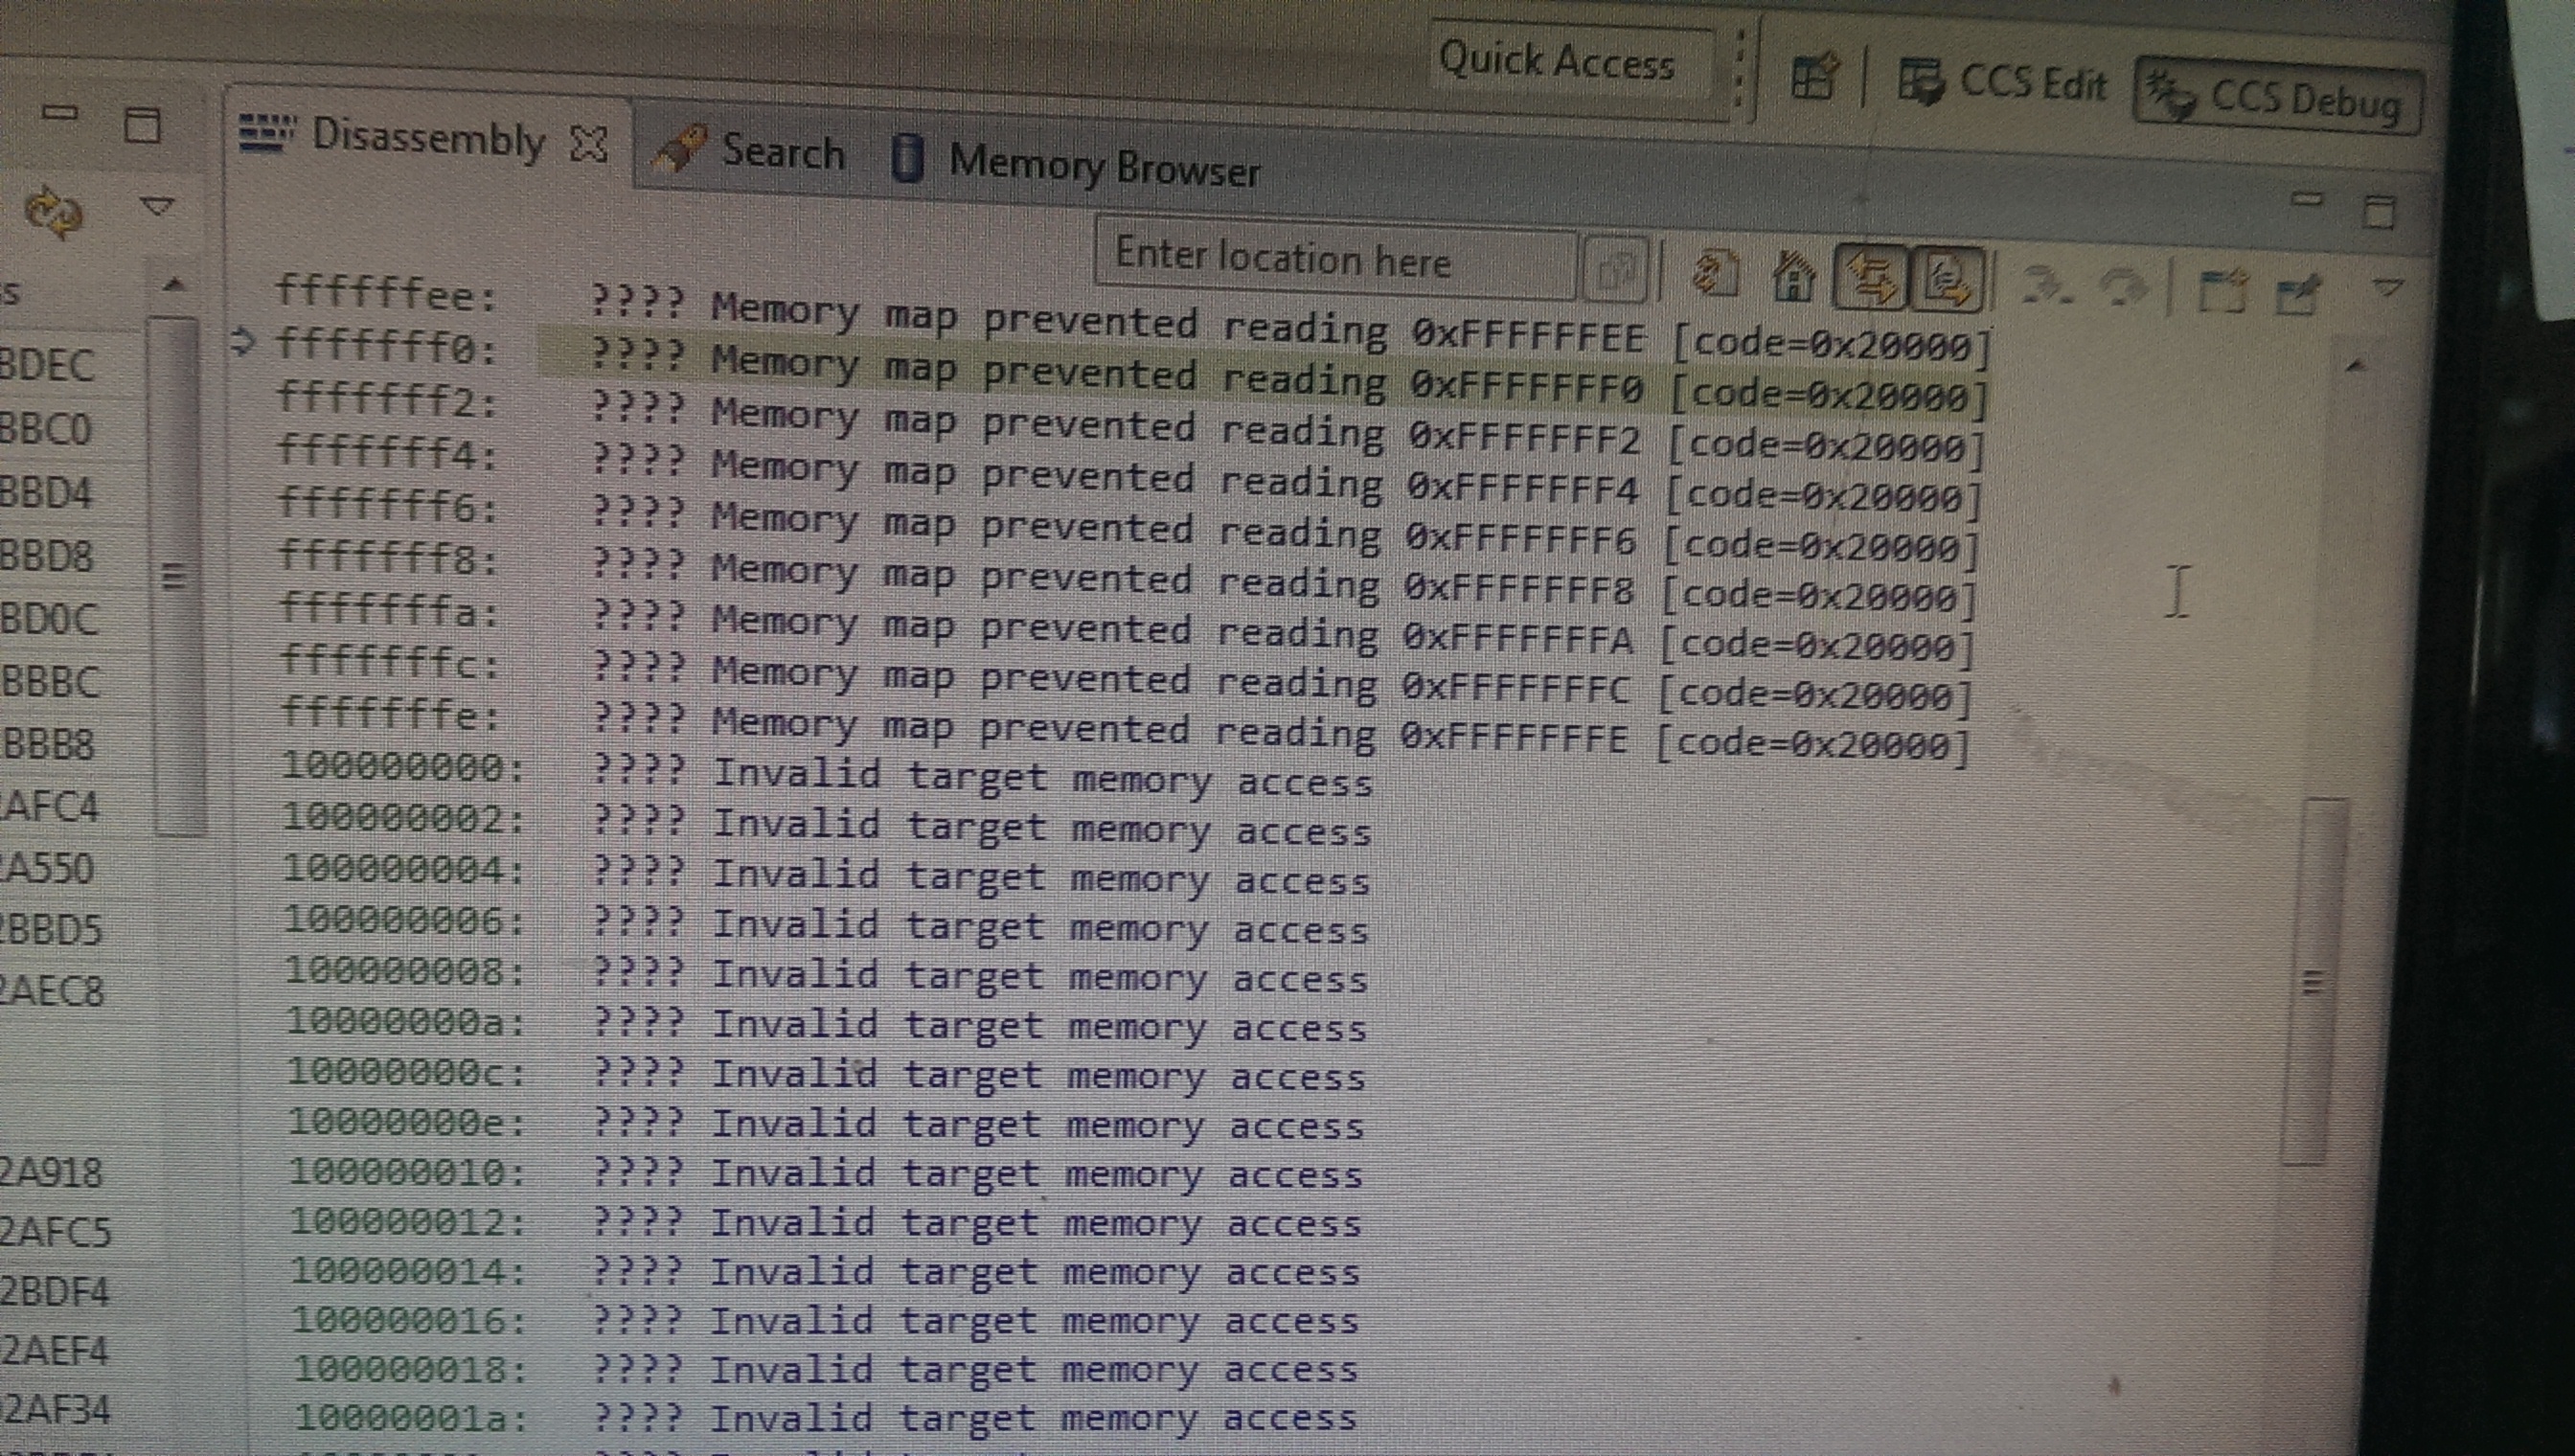
At that time, the NVIC_FAULT_STAT is 0x0008200, and the NVIC_FAULT_ADDR hold a address at reserve in Memory Model.

Could anybody help me to find this error and fix it?

Thank you.

  • Hello Thao

    What is the value of the FAULT_ADDR?

    Also did you trace the stack to the calling function?
  • Hi Amit
    Fault_addr is between 0xE004.2000 to 0xFFFFFFFF , 0x03000000 TO 0x1FFFFFFF....
    when the error happened i pause the debuging and disassembly at PC address and it was in faultisr().
  • Hello Thao,

    Check the stack pointer to see where the stack is pointing to and check what is the address of the calling function. That ways you can see which part of the code was being executed which caused the bus fault.
  • Hello Thao,

    Also make sure you have sufficient Stack allocated during the linker phase.
  • Hello Amit

    How can I know how many stack memory the program needed?
  • Hello Amit

    I get the stack point address. how to find the address point to which function.

    Thank you.
  • Hello Amit

    When the debug suspended i got this message

    FaultISR() at tm4c129encpdt_startup_ccs.c:262 0x00052B4A
    SysCtlDelay()[E:/THAOPTB2\DAQ\enet_snmp_mix_1912.out] at 0xFFFFFFF0
    SysCtlDelay() 0xFFFFFFF1 (next frame is identical to an existing frame)

    I'm looking forward to your support.

    Thao
  • Hi,

    To know the stack memory usaga in CCS, configure the compiler to generate listing file for each source file. The listing will show you the stack size needed for each function in your source code.

    The linker add a hidden variable named _stack to the application so you can add it to watch window and see it during debugging.

  • Hello Thao,

    To increase the stack size, please check in the linker options for stack size. By default it is set to 512. Increase it to 2048 to see if it makes a difference to the time it takes for the Bus Fault to occur.
  • Hello Amit

    I has increased stack size but bus fault still occured.

    Thao
  • Hello Thao,

    Then you will have to trace the stack manually in the SRAM to find the calling function. To do so, check the position of the Stack pointer. Then one location before the pointer location check the value, it should be the LR stacked in the stack RAM. That would be the return address of the calling function.
  • Hello Amit

    When I debuged my code I got this error

    Can't find a source file at "C:/Jenkins/workspace/TivaWare-Git-Release/DriverLib/build/DriverLib.test/driverlib/gpio.c"


    Did this error cause bus fault?
    how can I fix this error?

    I use CCS version 6.2.0.00050, complier 5.2.5, TivaWare_C_Series-2.1.1.71.

    Best Regards

    Phan Thi Bich Thao

  • Hello Thao

    The issue comes as the pre-compiled driverlib.lib source file path cannot be resolved from the original machine. There are 2 ways out of it

    (a) Map it to the path of the files in the TivaWare on your machine
    (b) Import driverlib as a project, recompile it on your machine, then use the output in the project your are debugging.
  • Hello Amit

    My code didn't get this error Can't find a source file at "C:/Jenkins/workspace/TivaWare-Git-Release/DriverLib/build/DriverLib.test/driverlib/gpio.c" any more.

    Thank you.

    Thao
  • Hello Thao,

    What about the original error of Bus Fault?
  • Hello Amit

    I still get that error. Now, the debug window message is "No symboy are defined for 0xFFFFFFF0".

    Thao
  • Hello Thao

    That is because the PC is pointing to 0xFFFF.FFF0 which is an unmapped region. Now you need to go back with the help of the SP to see what was the calling function that is stacked in the SRAM.
  • Hi Amit

    When I use single step to debug my code it resumes at some line. How can I step into/over all my code.

    Thao
  • Hello Thao

    Debugging such a bus fault is not easy. Single stepping may not be the solution. When the Bus fault occurs, did you check the stack pointer value and which location in SRAM it points to? Once you know the Stack pointer value, then check the SRAM location it points to. Since the Stack Pointer is a LIFO operation, the location it points to will show in decrements of address the Link register value that has been stacked.
  • Hi Amit

    When the fault occurs, i suspend the program and get Stack pointer value in SP/core register/View Register. I click on the address and choose view at memory, disassembly. In Disassembly It points to Fault Isr(), i can't understand what in Memory browser window. Now, i don't know how to do next.

    I checked all my code. I use Uart 0, Uart 4, Uart 1 Rx, Uart 2 Tx, Ethenet, I2C 2 , watdog 0, Gpio K7, M3,4 in Tm4c129encpdt and all Perripherials are enable. :((

    Thao
  • Hi,

    When you have interrupt faults like that, please use stack frames history - these are inside debug window, upper left; when your program stops at a line, and shows that in debug window, press on the line below that - that is the stack frame which generated the fault; in code window shows the code line with problem. And in asm window shows the particular code when stopped.

  • Hi Petries

    I did the same thing as you mentioned. It pointed to memory that can't read.

    Thao
  • Hi,

    And the line below the second one? You can play with all lines listed in debug window. Please post a picture of debug window.

    You should be sure to have the symbol DEBUG defined in predefined symbols tab in compiler settings to have all memory regions with debug symbols. The only exceptions: if you have used ROM_ prefix for some functions, then remove that prefis and use the driverlib defined function and the second one is if try to build a release version - then revert to debug version.

  • Hi Petrei, Hi Amit

    Happy new year.


    These are some pictures of debug window when i get this error.

    Thao

  • Hi,
    Your picture shows "FaultISR()at tm4c129encpdt_startup_ccs.c:263 0x0005B616" which shoud be read as this: at line 263 in tm4c129encpdt_startup_ccs.c you have the problem.
    Since the name is not similar with that provided by Tiva driverlib, you should inspect that line in your file. The original Tiva file does not show anything special. If your file is the same as the original, then there are several steps to follow and inspect to get further info:
    a) generate a map file and a binary file (you must have that already). Open the binary file with an hex editor and inspect the first eight bytes from address 0x0. The first four bytes are the stack pointer location and the next four are the ResetISR address, which should be odd number. If even, then this is the cause of your problem(take care these are shown in little endian).
    b) inspect the map file and locate address 0x0005B616 and see what routine is placed there.
    c) How go further depends on the results from previous points.
    One question: did you used DEBUG symbol in predefined compiler options?

  • Hi Petrei

    I added DEBUG in predefined symbol but I still get this error.
    The second imagine attached is for line 0xFFFFFFF0(no symboys are defined for 0xFFFFFFF0) in debug window.

    Thao
  • Hi,

    You did not answered my questions a) and b) so it is impossible to think further to your problem.  

  • Hi Petrei

    I followed your guide  and this is the result:

    a,  In binary file, the first four bytes is even, the next four bytes is odd.

    b, In the map file, at the fault address it is FaultISR().

    Does my program stack overflow. I had increased   stack size 2 times in Properites/Build/ARM Linker/Basic Options/Set C system stack size, but it is still even.

    This imagine is binary file.

    Thao

  • Hi,
    Sorry to say, but your claims about a) and b) are not sustained by your picture. I do not know what tool you used, but suggest to use Total Commander (useful also for other operations on computer) to view the content of .bin file (select the .bin file and press F3 and 3). The address should be also displayed.
    The stack address should be even; only the ResetISR address in interrupt vectors should be odd.  
    Also seems you run a release version of your program - try to run a debug version and before running set a breakpoint at main. Then after loading the program this will stop at main. After that run again and see where your program stops. Also in my post on Dec. 20, I suggested to set a watchpoint at variable _stack to see your stack size. Keep in mind the stack size should be set from compiler settings.
    If you use some pre-compiled library taken from other sources (like git) take into account these may have bugs or compiled without correct settings. Amit suggested you build a separate library - you did not confirmed that. The unusual thing is this library contains startup_ccs.c and I wonder why - there are some modifications of the original provided by TI? Such file should not be included into library since it must be available for modifications of vector interrupts.
    If you use lwip with snmp, take into account the snmp there is/was not actively used or maintained and may be extremely buggy.
    Also, TI has an application note describing how to proceed when you have faults. Read that application note and use it, gives info about faults. (that should be the first use in such case). learn it because almost always you are alone at this kind of bugs.