This thread has been locked.

If you have a related question, please click the "Ask a related question" button in the top right corner. The newly created question will be automatically linked to this question.

RTOS/TM4C129ENCPDT: Hard Fault when stepping over certain function calls (e.g. I2C_transfer)

Part Number: TM4C129ENCPDT
Other Parts Discussed in Thread: TMP006

Tool/software: TI-RTOS

Hello All,

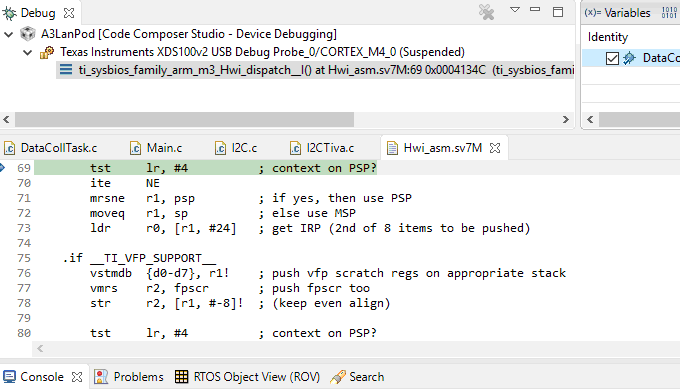
I'm having a problem debugging some code for a TM4c129ENCPDT processor utilizing the TIRTOS.  Specifically, I cannot step over certain functions without getting an exception (hard fault) and aborting.  Once that happens, I'm off in the weed somewhere with no symbols available.  I'm aware of the trick of replacing the SP and PC with the values from the exception dump, but in these cases even then there are no symbols for the locations. 

Here are some other interesting data points:

1)  I can run the code without stepping and it seems to work fine.

2)  I can place breakpoints before and after the offending function calls, hit the first one, then run to the second one, and that works fine.  I just can't step over the function call, or I get the results mentioned above.

3)  I mention I2CTransfer as an example, but there are other cases too.  I ~think~ the common denominator is that the RTOS is rescheduling during that function call.

4)  I am using an XDS100V2 jtag probe.

5)  This job uses proprietary hardware, but its essentially just a reference design with some ADC and memory peripherals.

My best guess is that it has something to do with the ability of the debugger to place its breakpoint when stepping, despite my being able to do it manually.

Thoughts?  Suggestions?

It's quite difficult and time consuming to revert to serial or console output for debugging.  Plus, it brings its own timing issues.

  • Hi Stan,

       Can you uncheck the two checkboxes and try again, do you see if it makes a difference? There could be a TI-RTOS issue where I found a relevant post talking about the same.  


  • I think I've seen that thread. I tried unchecking the 'When source stepping' box, but what happens then is that the next 'step' takes you into some interrupt handler or something rather than stepping over the source level function call
  • FWIW, the dump I get when I try stepping over the function is exactly identical to the one the OP in that other thread got:

    FSR = 0x0008
    HFSR = 0x40000000
    DFSR = 0x00000001
    MMAR = 0xe000ed34
    BFAR = 0xe000ed38
    AFSR = 0x00000000
    Terminating execution...

    And when I uncheck both boxes and step, I end up here:

    Is there something here that I should be seeing as a clue?

  • Sorry, the capture didn't past right last time.  Here is where i end up when I try to step while having those boxes unchecked:

  • Hi Stan,
    I will seek our TI-RTOS experts to see if they can provide guidance.
  • Stan,

    The debugger single stepping setting advice given is correct when stepping through code that may block and then asynchronously start again. You should not disable interrupts while single stepping in that case. To work around that, you should be able to explicitly set a breakpoint at the next line you want to break at and then run to it. If you never arrive at that location, but instead find yourself always in the interrupt dispatcher, then I would suspect there's an interrupt firing that is either not being serviced properly (meaning that it remains active even after the ISR code has run), or that the interrupt is repeating at such a high rate that the background thread is never being returned to.

    If you have ROV working in your CCS debug session, the Detailed 'Hwi' view will show you which interrupt is currently being serviced (it will be tagged as "Enabled/Active") when you halt the application.

    If you don't have ROV working, you can use the debugger's register view to determine the number of the interrupt being serviced. It is contained in the least significant 8 bits of the xPSR register (ie the EXCEPTION field).

    In this case, knowing the interrupt number being serviced will help identify the issue.

    Alan

  • Hi Alan!

    I'm not clear on what you mean when you say "To work around that". Do you mean to avoid stepping down into asm when ints are enabled and I'm stepping over the function? If I have to set a breakpoint after the line I want to step over and Run to it anyway, I guess it really doesn't matter whether I leave that box checked or unchecked. No?

    When my code blows up on a step through (when ints are disabled when stepping), I believe ROV told me that int #3 is active, and int 14 is pending.

    When I uncheck that box to leave the ints enabled and try to step over the function, it was automatically stepping down into asm as I noted before. But I just tried something else that maybe explains it: When I unplug the ethernet cable, it steps over it just fine. (again, this is with ints left enabled.)

    So maybe that's just the Ethernet MAC interrupt I'm seeing in that particular case. Does that make sense?

    Stan
  • Alan,

    Have you had a chance to see my reply dated Sept 5th? Also, I notice that the detailed tab in the HWI view shows me an interrupt with a function named only __ASM__, with a priority, group and subpriority of 0. When I examine the address shown, there's not code there. Just zeroes.

    Is there a way for me to tell where that entry is coming from? Is it something relevant to my problem?

    Stan
  • Stan,

    I saw your earlier post but got bogged down and forgot to reply to it. Yes, by "work around that" I meant the problem of stepping into ISR code rather than the next line of C code you were trying to step to. You have to uncheck the box to force the debugger NOT to disable interrupts while single stepping. I would expect the debugger not to disable interrupts when 'running' to a breakpoint.  Curiously though, the problem you're seeing has been being reported a lot recently even though no change has been made in the underlying code that requires interrupts to be enabled while stepping for over 8 years...

    With the boxes unchecked, if an interrupt fires while the debugger is paused, the next step will go into the ISR code rather than the next line of C or ASM code you were stepping through. By unplugging the ethernet cable, I suspect all you've done is suppress the troublesome interrupt, thus allowing your single stepping to proceed without interrupts.

    Regarding the ROV HWi detailed view, I believe this is a problem we had for a while with not-yet constructed Hwi objects. Our ROV view code was earnestly attempting to interpret the fields within the non-constructed Hwi objects, thus leading to bogus rendering of the Hwi object content. Our newer SYS/BIOS releases (beginning with 6.50.00.10 ) have been updated to detect non-constructed Hwi objects and not try to decode them.

    Alan

  • I had a similar experience with Tivaware example programs that uses I2C like temperature_tmp006. When I run the program there is no problem. But when I debug step into I2C functions, there is some error.

    - kel
  • Thanks, Alan.

    At least I know it's not something specific to my code. :)