This thread has been locked.

If you have a related question, please click the "Ask a related question" button in the top right corner. The newly created question will be automatically linked to this question.

CCS/TM4C1294NCPDT: Hardware Trace Analyzer (interrupt/function profiling) do not capture any thing with XDS200 on TM4C1294NCPDT

Part Number: TM4C1294NCPDT

Tool/software: Code Composer Studio

Hi,

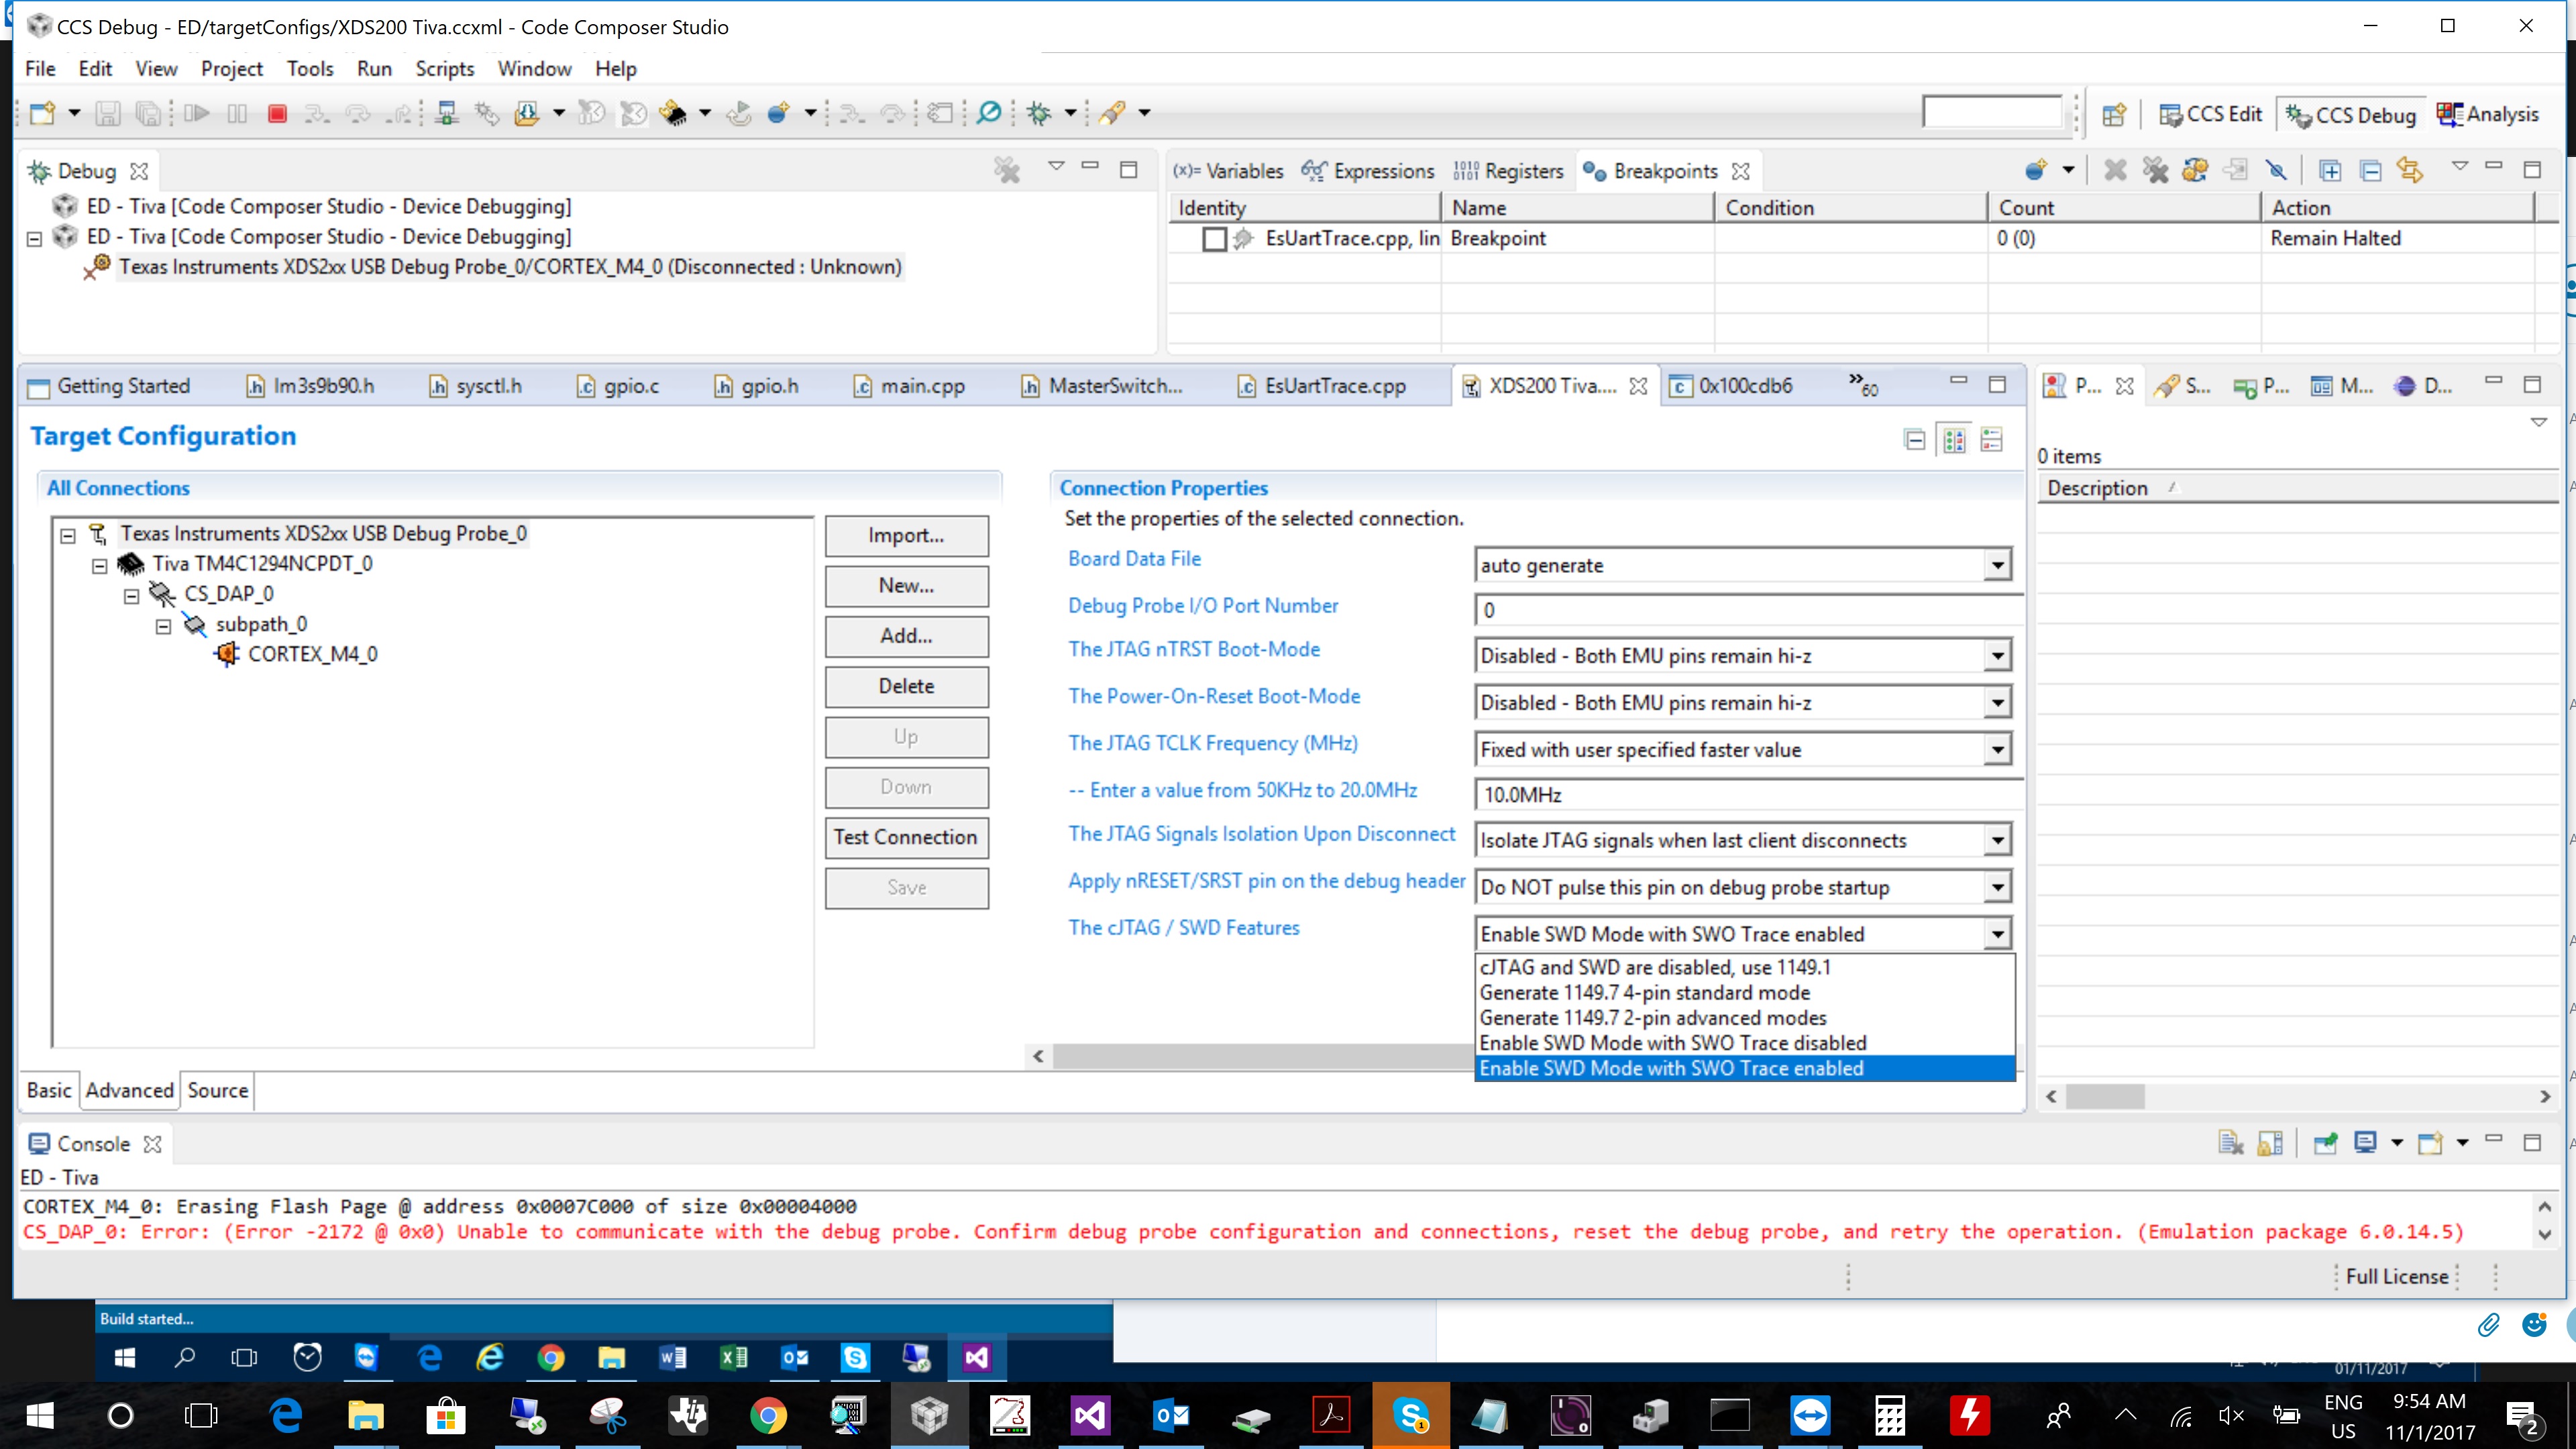
We just bought XDS200 for interrupt and function profiling. I can use XDS200 to debug, and everything work fine. But when I start Interrupt profiling or statistical function profiling, I do not have any record capture. I start profiling after system clock was set. I am not sure what is going on. I keep trying for about 2 days now. Can you give me any direction?

Regards,

Bandu

  • m.bandu said:
    But when I start Interrupt profiling or statistical function profiling, I do not have any record capture. I start profiling after system clock was set.

    In the Target Configuration, under Connection Properties what is the "JTAG / cJTAG / SWD Mode" set to?

    For the hardware trace analyzer to capture any data the mode needs to be set to "SWD Mode - User COM port is target TDO pin".

  • Hello Chester,

    Thank you for your reply. I am using Code Composer Studio 6.1.2.00015.

    I saw about that in one Wiki. But my CCS don't have that option. Please see the attached screen print. How do i need to do to get that option? Thank you.

  • m.bandu said:
    I saw about that in one Wiki. But my CCS don't have that option

    Some comments:

    1) It looks like a TI emulator update changed the name of the options. With CCS 6.1.0.00104 and TI Emulators 5.1.641.0 I get the option named "Use SWD Mode with SWO Trace enabled". Whereas with CCS 6.1.2.00015 with TI Emulators 6.0.628.1 the option is named "SWD Mode - Aux COM port is target TDO pin".

    In your case the option to use should be "Use SWD Mode with SWO Trace enabled".

    2) After selecting a hard trace analyser, can you press the "Advanced Settings" button on the Hardware Trace Analysis Configuration dialogue:

    And on the Advanced Properties check the UART Options:

    I have had problems in the past with the hardware trace analyser not showing any results if either:

    a) The Clock Frequency was set to "Automatic", and the detected clock frequency was incorrect. In which case selecting a "Manual" clock frequency and then entering the actual target clock frequency fixed the problem.

    b) If the COM port is incorrect for the debug probe COM port which provides the SWO output. In your case check that the COM port is that of the "XDS2xx User CDC Serial Port" shown by the Windows Device Manager.

    3) Using CCS 6.1.2.00015 with TI Emulators 6.0.628.1 I was able to get hardware trace analyser output for a TM4C1294NCDPT connected with a XDS110 set to "SWD Mode - Aux COM port is target TDO pin", but don't have a XDS200 to test.

    4) If the suggestions to check the UART options on the Advanced Properties don't fix the problem, try using the CCS Help -> Check for Updates to see if there is an update for the TI Emulators.

  • Thank you so much again Chester. I will try those and come back to you.
  • *** LIKE ***
    Even though the choice of "lesser tools" concerns - the depth of explanation & clear detail - clearly must be applauded!     GREAT Job, Chester...

  • Hello Chester,

    I am using TI emulator 7.0.48.0 with CCS 6.1.2.00015.
    Setting Clock frequency by "Manual" and actual target clock frequency to 120,000,000 definitely fixed the issue.

    thank you so much for your help.

    Regards,

    Bandu