This thread has been locked.

If you have a related question, please click the "Ask a related question" button in the top right corner. The newly created question will be automatically linked to this question.

CCS/TM4C123GH6PM: FaultISR debugging (PC and LR on stack don't seem to point to the problem)

Part Number: TM4C123GH6PM

Tool/software: Code Composer Studio

I am working on a large project completely written in C (other than the standard startup code).  After some recent code changes, it started crashing (ending up in FaultISR).  It happens consistently after running for about six seconds.  I have been following the troubleshooting instructions in http://www.ti.com/lit/an/spma043/spma043.pdf, which I'll get to below, but first a summary:

  • The program runs on "bare metal" (no RTOS).
  • There is plenty of stack space.
  • I don't think it is a problem with failing to enable a peripheral before using it (although I have done that before).

The source of the problem is elusive:

  • If print additional debug messages, can get the problem to disappear.  But I want to know the root cause and fix it, not just make it go away.
  • Using the stack pointer to find the PC that got pushed when FaultISR was called leads to code that hasn't been changed recently.  Can delete that code and the problem moves somewhere else. 
  • Using LR to find what was going on one more step back leads to code that couldn't possibly call the code the PC leads to (although it could happen the other way around).
  • The changed code seems unrelated to the crash, other than perhaps moving things around in memory or affecting the timing.
  • It crashes in the same way on a second set of hardware (both of which have been well used without problems in the past).

I have not done debugging with this (or any ARM based) MCU at this level before, so the answer might be under my nose and I am just missing it.  Anyway, this is the result of one recent debug session that I think follows the process from http://www.ti.com/lit/an/spma043/spma043.pdf with some additional steps to keep the stack as clean as possible before the crash.

Using CCS V9 IDE and the TI v18.12.2.LTS compiler. More on optimization levels later.

Disabled the debug configuration option to auto run to main() on program load or restart. Manually set a breakpoint on main(). Filled the 2048 byte stack at address 0x20005EB8 with 0xAA.

Re-loaded the program using the debugger. It is stopped on _c_int00_noargs() in boot_cortex_m.c. The stack is unchanged (all 0xAA).

Let it run to the beginning of main(). It used 10 32-bit words of stack space getting here. The stack pointer is now pointing to __STACK_END, so re-filling the stack with 0xAA again, so can see what it does after this.

Letting the program continue to run from the beginning of main(). After about 6 seconds it stopped at a breakpoint I had set at the beginning of FaultISR(). It does this consistently.

  • The bottom of the stack still has 332 bytes filled with 0xAA, so it didn't run out of stack space.
    • I also ran it with twice the stack space, with exactly the same result.
    • It seems a bit odd to me that some portions of the stack (other than the bottom) still have 0xAA in them. Perhaps there are some arrays or uninitialized structures used as automatic variables which get space allocated for them but don't get initialized.

  • Core registers are:

  • Some NVIC registers:
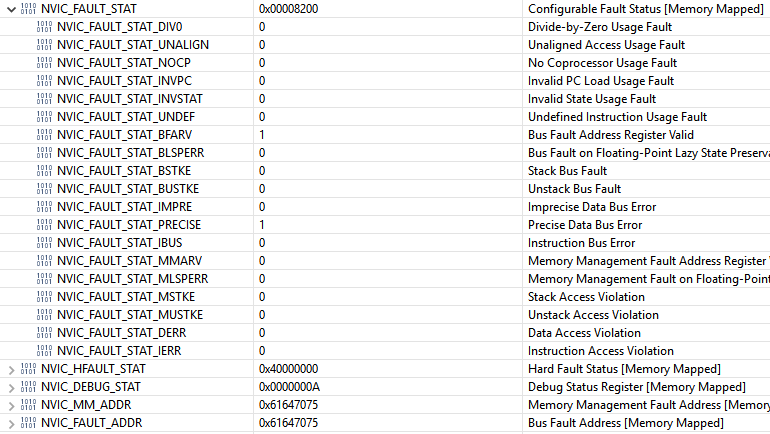
  • NVIC_FAULT_STAT is 0x00008200, with these bits set:
    • NVIC_FAULT_STAT_BFARV - Bus fault address register valid
    • NVIC_FAULT_STAT_PRECISE - Precise data bus error
  • Since NVIC_FAULT_STAT_BFARV is set, can read NVIC_FAULT_ADDR, which is 0x61647075. That isn't a valid memory address. So the bus fault was precise, probably a read from address 0x61647075.
  • I have more than just a while(1) in FaultISR(), but at this breakpoint SP has not yet been adjusted for them. So the standard ISR stack frame should exist at the SP value of 0x20006620. So the register values there are:
    R0: 0x61647075 (the fault address)
    R1: 0x0000161D
    R2: 0x00000001
    R3: 0x000000B3
    R12: 0x00029C2B
    LR: 0x00013CFD
    PC: 0x00003CF8
    xPSR: 41000000
    • Shouldn't PC be an odd number (like LR) to indicate that the TM4C123 is using the Thumb instruction set?
  • Plugging the PC into the disassembly window:
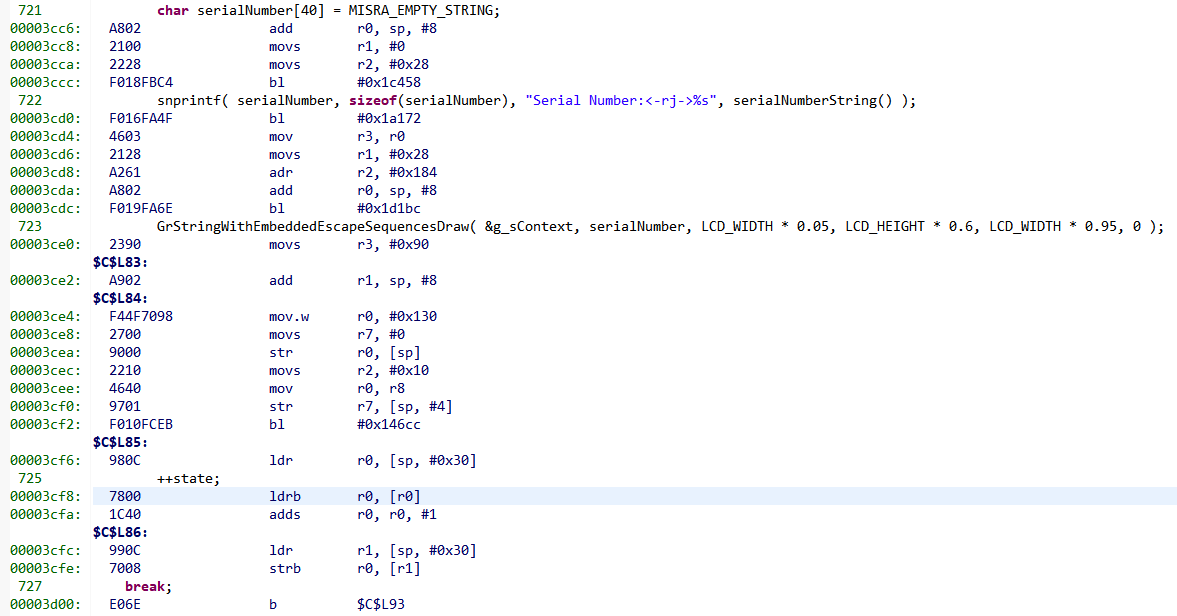
    • So doing "ldrb r0, [r0]" when r0 has the value 0x61647075 causes a bus fault. That isn't surprising.
    • Double-clicking on that line to set a breakpoint on it, then double-clicking on the breakpoint to open that line in the C source ("++state;"). It is part of function lcdDisplayUpdate() which uses a state machine implemented as a switch statement.
          case DISPLAY_LIFTER_SERIAL_NUMBER:
          {
              GrContextFontSet(&g_sContext, FONT_SANS_SERIF_23px);
              char serialNumber[40] = MISRA_EMPTY_STRING;
              snprintf( serialNumber, sizeof(serialNumber), "Serial Number:<-rj->%s", serialNumberString() );
              GrStringWithEmbeddedEscapeSequencesDraw( &g_sContext, serialNumber, LCD_WIDTH * 0.05, LCD_HEIGHT * 0.6, LCD_WIDTH * 0.95, 0 );
      
              ++state;
          }
          break;
      
    • State is declared at the top of the function like this:
          static state_t state = INITIAL_STATE;
      
  • It isn't apparent to me how the address of the variable "state" would get messed up such that trying to read its value with "ldrb r0, [r0]" would access address 0x61647075 rather than something in SRAM (0x2000xxxx). I don't know the Thumb instruction set at all, so maybe there is a clue in the disassembled code that I am not seeing.
  • Taking a look further back at the disassembled code around the value of LR on the stack, 0x13CFD, expecting the previous instruction to be a branch to the function in which it crashed. Need to ignore the set LSB, which just indicates it is using the Thumb instruction set, so looking at 0x13CFC.
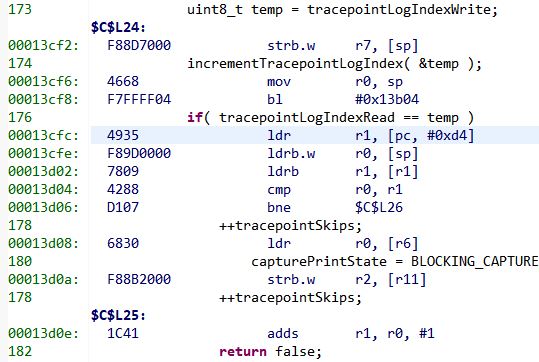
    • Actually, the important instruction is the one before, in this case "bl #0x13b04".
    • That is in function tracepointLog(), which is used to record debug info for later printing.
  • Looking at the code at 0x13b04.
    • That is the beginning of function incrementTracepointLogIndex(), which is a helper function for tracepointLog(). It makes sense that it would be called from tracepointLog().
    • Based on this being the target of the branch in LR, I would think that it would be the function in which the crash occurred. Maybe it is.
    • But based on the PC on the stack when we reached FaultISR(), the crash occurred in lcdDisplayUpdate(). I don't know what to make of that.
    • incrementTracepointLogIndex() is a simple function. I don't see how it would cause a crash.

I am not sure how to dig any deeper into this specific crash.  I am trying some other things hoping to get more info, but any hints about how to debug this would be greatly appreciated.

Steve

  • Hello Steve,

    First off all, thank you for taking the time to detail all the steps you've taken so clearly. The stack overflow test is definitely comprehensive and definitive.

    Unfortunately E2E wasn't quite as nice, and it seems the images you tried to attach didn't upload right. If you could try to edit your post and re-add them, that may further help, but I think I understood everything regardless.

    From a peripheral enable standpoint, there are two thoughts I have.

    1) Are you checking for the peripheral to be Ready before any subsequent calls? See this post from Amit explaining the importance of this: e2e.ti.com/.../1715143 - I ask this because many bus errors we have solved on E2E traced back to that.

    2) Would it be possible for an interrupt to make a call to a peripheral that wasn't enabled or had been disabled...? It could possibly explain why the failure moves around if an interrupt is involved. Though I would think that there would be signs of that in the stack dump, but just throwing out ideas for a moment though.

    Additionally, if you think the crash could tie back to lcdDisplayUpdate, can you post the rest of the source code so I can take a look just to get a feel for what is going on in that API? The snippet alone paints an incomplete picture for me of what all is going on in the function as a whole, how the states work, etc. I agree that incrementTracepointLogIndex doesn't sound like something that would cause the crash. But the lcdDisplayUpdate seems more plausible.
  • Steve Strobel said:
    I am not sure how to dig any deeper into this specific crash.

    Which debug probe do you use?

    If use a probe such as a XDS110 or XDS200 which supports SWO trace with CCS, then the CCS Hardware Trace Analyser could be used to give an insight into the behaviour leading to the crash without having to add instrumentation to the software. E.g:

    a. Use the Interrupt Profiling to view the handled interrupts.

    b. Use the Statistical Function Profiling to look at samples of the PC.

    These won't necessarily instantly point at the line of code which causes the problem, but can help to focus on when the program starts to misbehave.

  • Thanks for letting me know that the images didn't upload right. I had originally copied almost the entire post from a Redmine ticket and pasted it into the editor here thinking I would get only the text. Surprisingly the images also showed up, so I didn't bother uploading them individually. I checked in an Incognito tab and they showed up there as well, so I thought all was well. But after your reply, I checked with a different browser (Edge rather than Chrome) and could see that they were broken. They should be fixed now.

    A co-worker found what is apparently the root of the problem, an array overrun in lcdDisplayUpdate(). The PC on the stack pointed to a place where the array access was properly bounded and I missed the code a few lines earlier where it was not. I haven't yet followed through to determine what got overwritten nor why overwriting it led to FaultISR(), but I'm planning to do that.

    I'll also check to see if the code waits for the peripheral to be ready as you suggested. The symptoms in that post sure sound similar. I'm curious about what happens in those cases. I got the idea from spma043.pdf that if you try to access a peripheral that is not enabled that the NVIC_FAULT_ADDR would point to one of the peripheral registers. Is that always true? In my case, address 0x61647075 is in an address range that Table 2-5 in the databook calls a memory region for "External RAM" with the description "This executable region is for data". I am guessing that since I don't have the MCU configured for an external memory device at that address that it generates a bus fault when accessed. In any case, that address didn't point to anything I found helpful.

    Thanks again for your help.
  • Hello Steve,

    Glad to hear the issue was tracked down, and that our debug advise did ultimately lead you to the right function. Array overruns are joyous gremlins, aren't they?

    Typically the overrun would corrupt the stack and result in the program getting sent to the 'weeds' so to say which would make sense for the Fault ISR that is basically a catch all for what doesn't fit into the other ISRs (Reset, NMI, and Default Interrupt Handler).

    Yes if a peripheral is not enabled you should see it point to the peripheral memory location on the memory map. The address in your case probably was just overwritten stack values that had no meaning in the end.
  • To date I have been content using something equivalent to an XDS100; this is the first problem in years that got me decoding stack frames and looking at disassembled code. But I would certainly be interested in more capable tools. I looked at some of the options and found the situation to be more complicated than I expected.

    If I am understanding it right (please correct me if I am missing something), there are three main levels of debug capability: JTAG/SWD, SWO and ETM. JTAG/SWD is all that is available with the XDS100. On the other end, ETM gives full trace capability but the debug probes (J-Trace, I-Jet, uLinkPro) are expensive and CCS doesn't support doing trace with them (you need different debug software). SWO is the middle ground, with some additional capabilities (not full trace) but with less expensive debug probes and support within CCS.

    The XDS110 apparently supports SWO on the MSP432, but on the TM4C123, it looks like I would need the XDS200 (per processors.wiki.ti.com/.../SWO_Trace. J-Link also supports SWO for the M4F MCUs, and I think I just saw a CCS plugin with support for it get added a month or two back. Is one of those better than the other, or is there another option I should look into?

    Thanks for any recommendations.
  • Steve Strobel said:
    The XDS110 apparently supports SWO on the MSP432, but on the TM4C123, it looks like I would need the XDS200 (per processors.wiki.ti.com/.../SWO_Trace.

    I have used a XDS110 to capture SWO from a TMC129, but haven't tried with a TM4C123. I think the XDS110 should also work with a TM4C123.

    Steve Strobel said:
    J-Link also supports SWO for the M4F MCUs, and I think I just saw a CCS plugin with support for it get added a month or two back

    While J-Link supports SWO, the last time I checked CCS didn't support SWO with a J-Link - Segger J-Link support appears to be incomplete in CCS 7.0.0.00022. Need to check if support has since been added.

    Steve Strobel said:
    Is one of those better than the other, or is there another option I should look into?

    As part of the investigation into CCS/MSP-EXP432E401Y: Statistical Function Profiling using a XDS110 causes CCS to hang if try any select a Sampling Interval of 832 cycles (or lower) found that a XDS110 could capture SWO trace at a higher rate than a XDS200.

  • Thanks Ralph and Chester for the suggestions and the info about debuggers.

    As it turns out, in my case the array overrun was consistently one 32-bit word. In some builds the overrun hammered the loop index in such a way that it terminated the loop, so the only thing that got overwritten was harmless. In other builds, the overwritten byte didn't get used at all before the stack frame went out of scope, so that was harmless too. But in the builds that crashed, it overwrote a pointer stored on the stack with a value that wasn't a valid memory address. I was fortunate it wasn't valid, as that would have been even harder to track down. Changing the optimization level or even inserting code in unrelated places could change what got overwritten.

    Does anyone have a suggestion for catching any similar bugs that might still be lurking? Compiling as C++ rather than C and using std::array looks like it might work well. If it uses additional resources, I could wrap it in a macro and revert to raw arrays after testing.

    FWIW, there were a few quirks in the toolchain that made this issue more difficult to troubleshoot than it needed to be:

    * The line of C code that is indicated by the debugger is sometimes not even close to the part of the code that is actually being executed, but perhaps has identical source code. In my case, I use a switch statement to implement a state machine. The end of many cases it does "++state;" and "break;". When stepping through the assembly code, it is clear what is going on. But in the C code, the debugger sometimes points to "++state;" in the wrong case. I could understand why it would do that if it was using tail call optimization, but the PC is different when actually executing each of those cases, so it seems like the debugger should be able to distinguish between them. I also saw that happen with calls to a debug message printing macro, even though when expanded that macro passes in __LINE__ as one of the arguments and it had a different value in each case. I am using the TI v18.12.2.LTS compiler.

    * When the Memory Browser window is set for "32-Bit Hex - TI Style" and you view a region with statically-allocated variables, it shows only the variable names that are 32-bit aligned and makes them all appear to be multiples of 32-bits in size. I guess that keeps it true to the 32-bit style, but when you are looking at the memory which holds an 8-bit or 16-bit value and the corresponding variable name isn't displayed anywhere, it is confusing. A possible remedy would be to keep the displayed values in 32-bit format but list _all_ of the variable names rather than just the one that is 32-bit aligned. Selecting an 8-bit style is a workaround (as long as you know to do it).

    * The map file seems to have a similar issue, listing only the addresses of variables stored on 32-bit aligned addresses. I don't see any justification for this, as (to my knowledge) there is nothing telling it to report in 32-bit mode. I think it should report the address of _all_ statically allocated variables regardless of their alignment.

    Is there someplace I should request changes to address issues like the ones above?
  • Hello Steve,

    You can make a post to the CCS forum, I am not sure if they have an official feature request site - you can ask that of them too. Sometimes I pass threads over to them, but with how in depth we went here, I think you'd be best served to make a new thread so the right eyes read over the right details :)

    I am more of a device expert than software guru and I hadn't run into an overrun issue like that in the developments I have worked on, so unfortunately I don't have any poignant advice on how to sniff out such a bug. As far as prevention goes, without knowing exactly how it's setup, the only thing that comes to mind is carefully defined bounds for the array index and checks to ensure that it cannot try to read or write in excess of the defined array size.