Other Parts Discussed in Thread: ENERGIA, SEGGER, EK-TM4C1294XL
Tool/software: Code Composer Studio
hello,
I am using TM4C1294NCPDT with version 7.3.0 of CCS.
My project config as energia sketch and I'm using energia libraries (Ethernet, core).
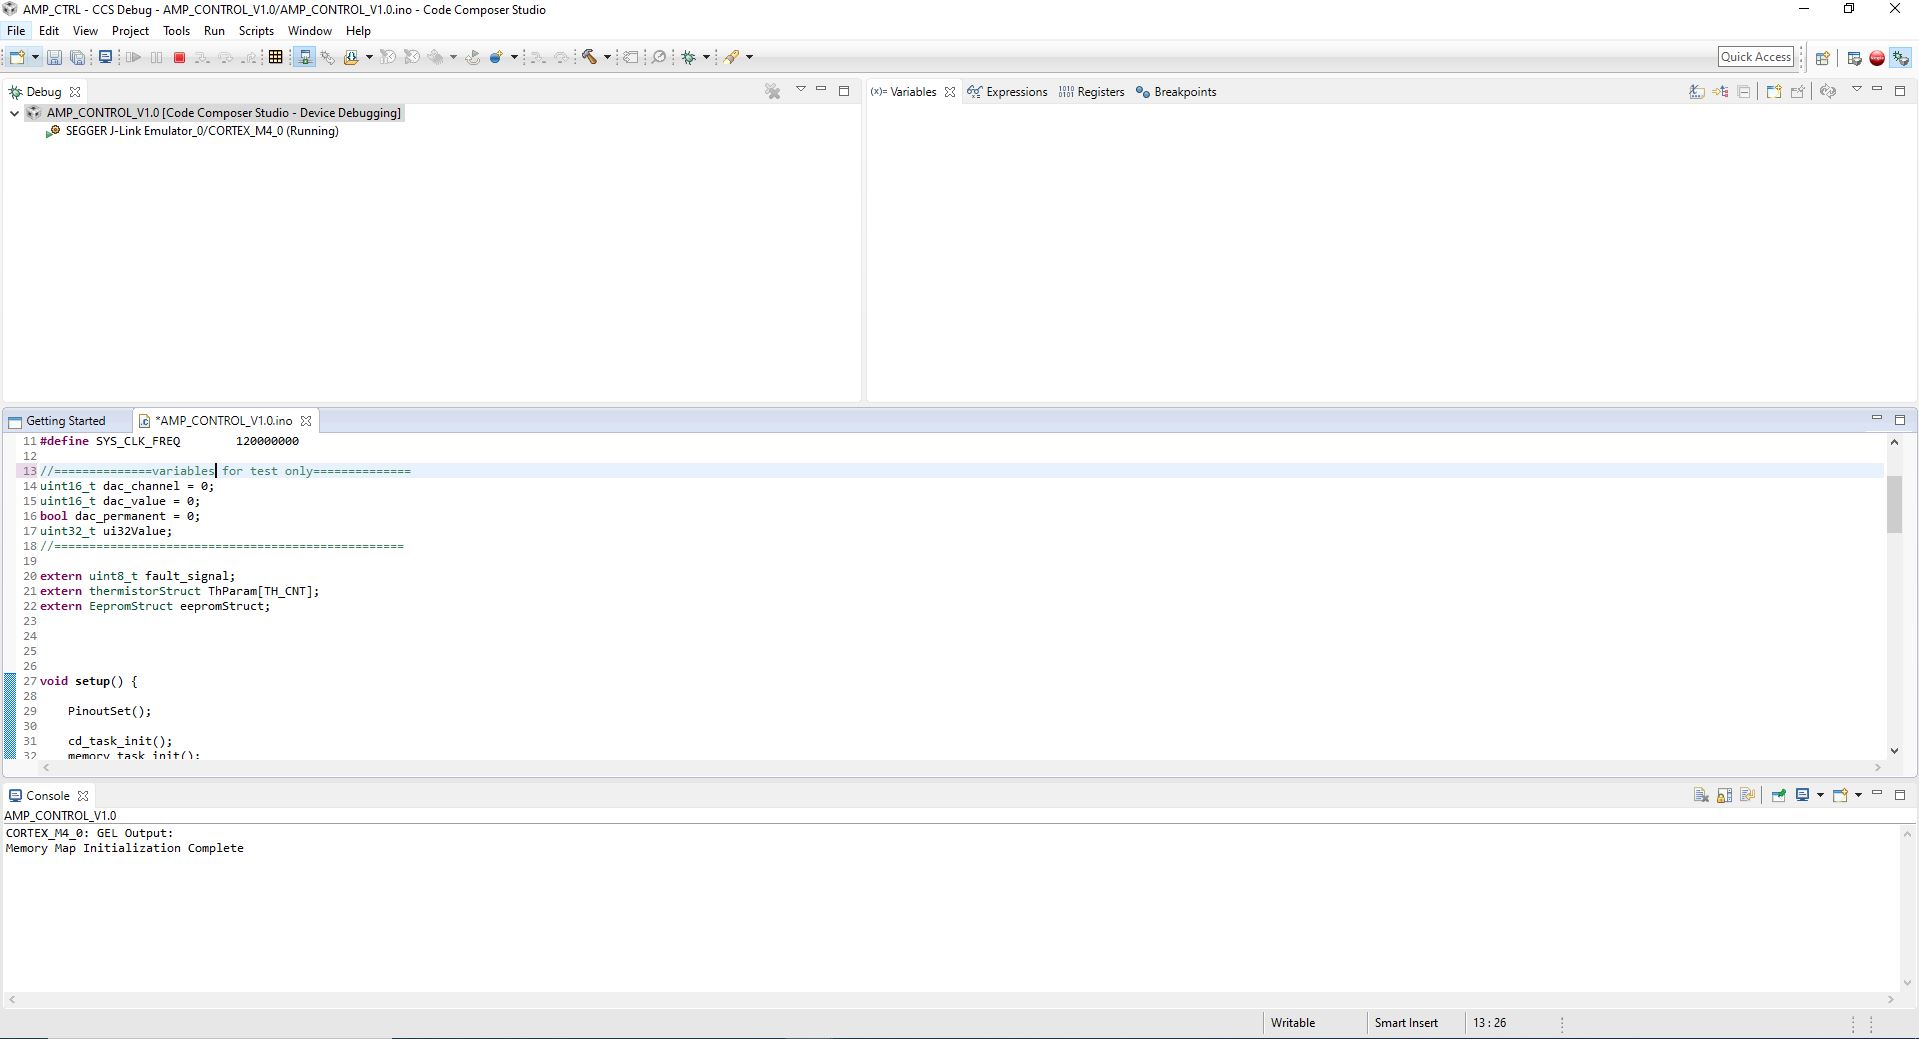
I having problems to debug it with Segger J-link,
I tried to updated J-link inside CCS but it didn't help.
There is something else I need to config?
thanks