This thread has been locked.

If you have a related question, please click the "Ask a related question" button in the top right corner. The newly created question will be automatically linked to this question.

TM4C129XNCZAD: Confusing Precise Data Bus Error

Part Number: TM4C129XNCZAD

After heavy testing, I'm seeing a few times where my code ends up in the FaultISR with an precise data bus error.  In the past, I've found the "Diagnosing Software Faults in Stellaris Microcontrollers" document (AN01286) to be quite helpful.  However, after trying everything in this document I'm still stumped on this one.

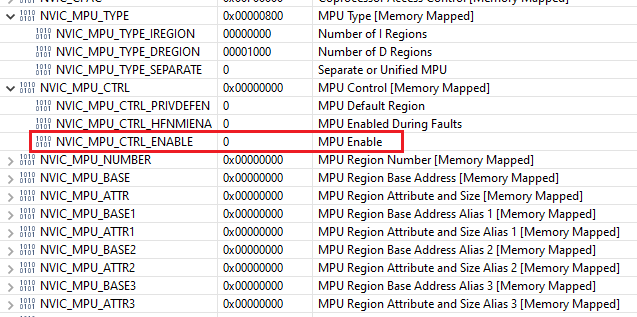
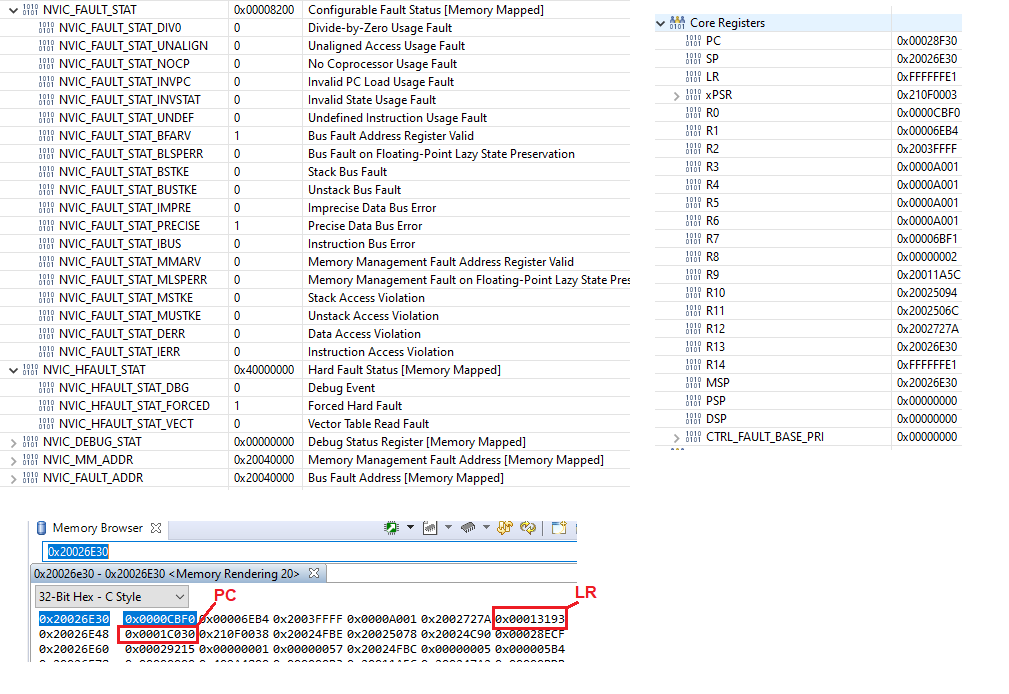
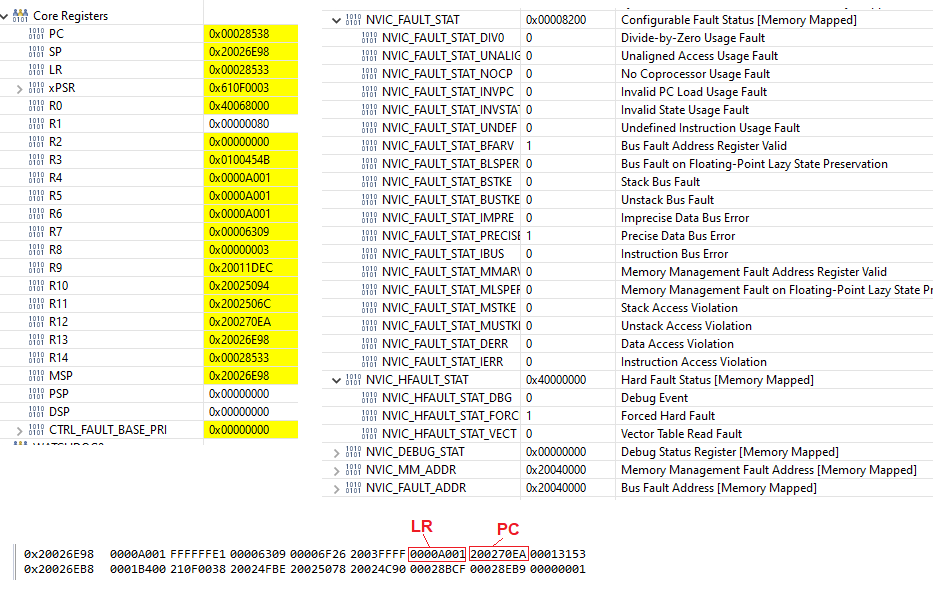
When in the FaultISR function, the core registers, fault registers and memory of the stack are shown below.

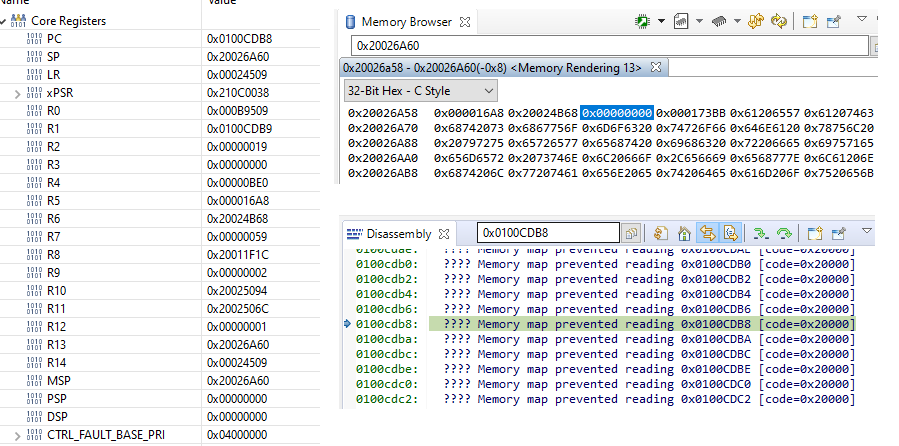
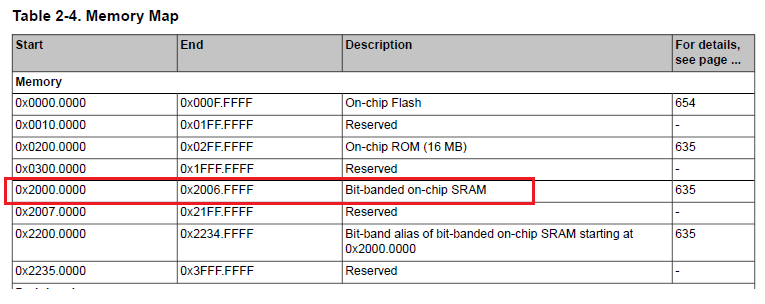
The program counter is not an actual section of code.  As the memory map from the TM4C129XNCAD datasheet shows below, this would be in SRAM.  Also, the fault address (0x20040000) is in SRAM too.  However, note that despite the memory map saying SRAM goes from 0x2000000 to 0x2006FFFF, I believe the valid area would only be from 0x20000000 to 0x2003FFFF since the TM4C129XNCAD datasheet states the microcontroller has 256K of internal memory (section 8, pg 633 of the datasheet) and my tm4c129xnczad.cmd file has SRAM length specified as 0x00040000.

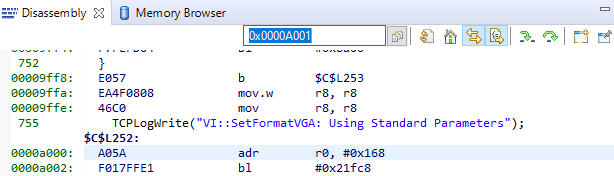
The link register on the stack (0x0000A001), does point to actual code (shown in the image below).  However, as far as I can tell, the code in the TCPLogWrite function is harmless.

Questions:

  1. Is the bus fault of 0x20040000 indicating that I've overrun the data area?  For example, something I might get if I were indexing through an array and went wildly past the last index to the point of being outside of the SRAM area (i.e. hitting memory address 0x20040000)?
  2. Is it safe to say the issue is likely happening in the TCPLogWrite function or might the LR be a red herring?

Thanks in advance for any thoughts anyone might have.

  • I think what is happening is that your code started executing from RAM and then made an access past the end of RAM. Unfortunately, it may have executed several instructions before creating the hard fault. Do you intentionally ever execute from RAM? Are you currently using the MPU? If not, you can program the MPU to not allow code execution from RAM. Then you might get the MPU fault before random code executes. The stack and LR should make more sense then.

  • Bob Crosby said:

    I think what is happening is that your code started executing from RAM and then made an access past the end of RAM. Unfortunately, it may have executed several instructions before creating the hard fault. Do you intentionally ever execute from RAM? Are you currently using the MPU? If not, you can program the MPU to not allow code execution from RAM. Then you might get the MPU fault before random code executes. The stack and LR should make more sense then.

    Hi Bob - Thanks for the reply.  I do not have experience with the MPU.  Looking at the MPUCTRL register, it appears it's disabled:

    I've found there's an mpu_fault example in the TivaWare and also example code in the TivaWare Peripheral Driver Library section 19.3.  Based on this, I've added the following to my code at the top of main:

      ROM_MPURegionSet(0, SRAM_BASE,
                       MPU_RGN_SIZE_256K | MPU_RGN_PERM_NOEXEC |
                       MPU_RGN_PERM_PRV_RW_USR_RW | MPU_RGN_ENABLE);
    
      ROM_IntEnable(FAULT_MPU);
    
      ROM_MPUEnable(MPU_CONFIG_HARDFLT_NMI);

    Do you agree this is the proper code to not allow code execution from RAM?

  • Yes, and you want a breakpoint at the beginning of your NmiSR. Let me know what you get.

  • Hmmmm...  I must be doing something wrong.  The call to MPUEnable() results in the FaultISR being triggered.  Here's my code:

    int main(void)
    {
      // Disable all interrupts
      IntMasterDisable();
    
      // Run from the PLL at 120 MHz.
      SysClockFreq = SysCtlClockFreqSet((SYSCTL_XTAL_25MHZ |
                                         SYSCTL_OSC_MAIN | SYSCTL_USE_PLL |
                                         SYSCTL_CFG_VCO_480), 120000000);
    
      MPURegionSet(0, SRAM_BASE,
                       MPU_RGN_SIZE_256K | MPU_RGN_PERM_NOEXEC |
                       MPU_RGN_PERM_PRV_RW_USR_RW | MPU_RGN_ENABLE);
    
      IntEnable(FAULT_MPU);
    
      MPUEnable(MPU_CONFIG_HARDFLT_NMI);
    
      ...

    Maybe there is some other initialization I need to be doing?  Do I need to enable a specific peripheral before calling MPUEnable() ???  I'm not seeing this in the examples...  The fault happens when setting the MPUCTRL register in mpu.c of the TivaWare Periph Lib as shown below (the last line in MPUEnable):

    void
    MPUEnable(uint32_t ui32MPUConfig)
    {
        //
        // Check the arguments.
        //
        ASSERT(!(ui32MPUConfig & ~(MPU_CONFIG_PRIV_DEFAULT |
                                   MPU_CONFIG_HARDFLT_NMI)));
    
        //
        // Set the MPU control bits according to the flags passed by the user,
        // and also set the enable bit.
        //
        HWREG(NVIC_MPU_CTRL) = ui32MPUConfig | NVIC_MPU_CTRL_ENABLE;  // Causes a fault
    }
    

  • Use:

        MPURegionSet(0, SRAM_BASE,
                         MPU_RGN_SIZE_256K | MPU_RGN_PERM_NOEXEC |
                         MPU_RGN_PERM_PRV_RW_USR_RW | MPU_RGN_ENABLE);
        IntEnable(FAULT_MPU);
        MPUEnable(MPU_CONFIG_PRIV_DEFAULT);
    

    We want the default map to govern those regions not specifically set.

  • Ah, okay, thanks.  I made that change, and after running the same tests that previously triggered the FaultISR, I'm no longer triggering the FaultISR but instead the program some how gets out of the main loop - I have an LED that periodically flashes in the main loop that stops flashing.  When I hit "pause" on the debugger, I'm in memory that does not make any sense to me.  Images below show the registers, memory of the stack pointer and disassembly of the PC.  Also, the fault registers (FAULT_STAT and HFAULT_STAT) are all zero.

    You mentioned I should set a breakpoint in the NmiSR in tm4c129xnczad_startup_ccs.cpp, which I did.  I also put one in my MPUFaultISR.  Neither of these breakpoints were hit.  These ISRs are super simple.  They just consist of a while(1); this is the line I put the breakpoint on.

    So....  I'm not sure what to do at this point.  Any suggestions?

  • Your device is executing from ROM space. I will do some more testing on my end to see if I can create the execute from RAM trap.

  • Ah, right, we generally make our TivaWare calls all ROM_ calls.  For example:

      ROM_SysCtlPeripheralEnable(SYSCTL_PERIPH_GPIOB);
      ROM_GPIOPinTypeGPIOInput(GPIO_PORTB_BASE, GPIO_PIN_7);

    If it would help, for the sake of debugging, I could do a mass change on all my source code to remove the "ROM_", recompile and retest.  Do you think that would be helpful?

  • If you have enough room in the flash, you can remove the "ROM_" prefix. Then the routines would come from the driverlib.lib library file. When you step into one of these routines, you will probably get asked where is the source code. You can navigate to the source file and continue source debugging. Likewise you can include specific source files from C:\ti\TivaWare_C_Series-2.1.4.178\driverlib in your project. You can copy them into your project space or just link to them. Then when you build, it will use the same build settings as the rest of your project and the debugger will know where the source code is located.

  • Okay, got it.  Let me give it a try and I'll report back.  Appreciate your continued help!

  • Okay, I did a mass replace, changing any "ROM_" function calls to be the "regular" calls.  I of course still have the MPURegionSet, MPUEnable calls in there.  I set breakpoints on the while(1) lines of the NmiSR, FaultISR and MPUFaultISR.  When doing testing, it eventually hits the breakpoint inside the FaultISR but never the other breakpoints - and the fault registers look the same as before (precise data bus error at 0x20040000 shown below).

    The core registers and stack are also shown below.  Note the PC and the LR on the stack now point to actual code and make sense, and the code at the location of the PC is doing something possibly suspicious: Pointer arithmetic inside a loop with variable iterations.  I'm going to inspect this farther to see if this is where the fault is coming from.  One question though: Does it surprise you that I'm not hitting the MPUFaultISR?

  • Terence D said:
    Does it surprise you that I'm not hitting the MPUFaultISR?

    Yes, and no. I expected an MPU fault but at a different address as I thought you might be executing from RAM. Since the fault address is still 0x20040000, it makes sense that it would be a bus hard fault (FaultISR). I suspect running the library functions from flash instead of ROM may have made it more clear. The MPU may not have had any impact. Let me know how your debug progresses.

  • Bob Crosby said:

    Terence D
    Does it surprise you that I'm not hitting the MPUFaultISR?

    Yes, and no. I expected an MPU fault but at a different address as I thought you might be executing from RAM. Since the fault address is still 0x20040000, it makes sense that it would be a bus hard fault (FaultISR). I suspect running the library functions from flash instead of ROM may have made it more clear. The MPU may not have had any impact. Let me know how your debug progresses.

    Ah, I think I see what you're saying.  I configured the memory region as follows:

      MPURegionSet(0, SRAM_BASE,
                       MPU_RGN_SIZE_256K | MPU_RGN_PERM_NOEXEC |
                       MPU_RGN_PERM_PRV_RW_USR_RW | MPU_RGN_ENABLE);

    ...I bet if I'd used MPU_RGN_PERM_PRV_NO_USR_NO instead of MPU_RGN_PERM_PRV_RW_USR_RW I would've gotten an MPU fault.

    Regardless, I'm quite certain I've found the issue: We use LWIP, and compute a checksum of the messages we send/receive.  There was a bug with calculating the message length on our end causing the message to look very large, so when stepping through the message payload data we went off the end of SRAM and got to memory address 0x20040000 causing the bus fault.  I'm working on fixing the bug right now.

    Many thanks for your help!  I'm not sure I would've gotten to the bottom of this without you!