This thread has been locked.

If you have a related question, please click the "Ask a related question" button in the top right corner. The newly created question will be automatically linked to this question.

TM4C129XNCZAD: Invalid execution sequence

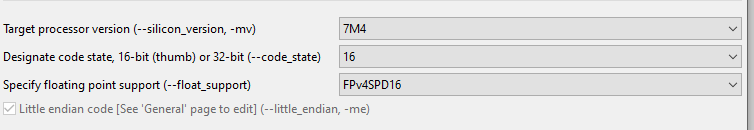
Part Number: TM4C129XNCZAD
Other Parts Discussed in Thread: SEGGER, , EK-TM4C1294XL, EK-TM4C129EXL, MSP-EXP432E401Y, MSP432E401Y

Hi,

We have been struggling with a very strange hard fault which either occurs every time after a while in the same conditions or never occurs (compile output dependent).

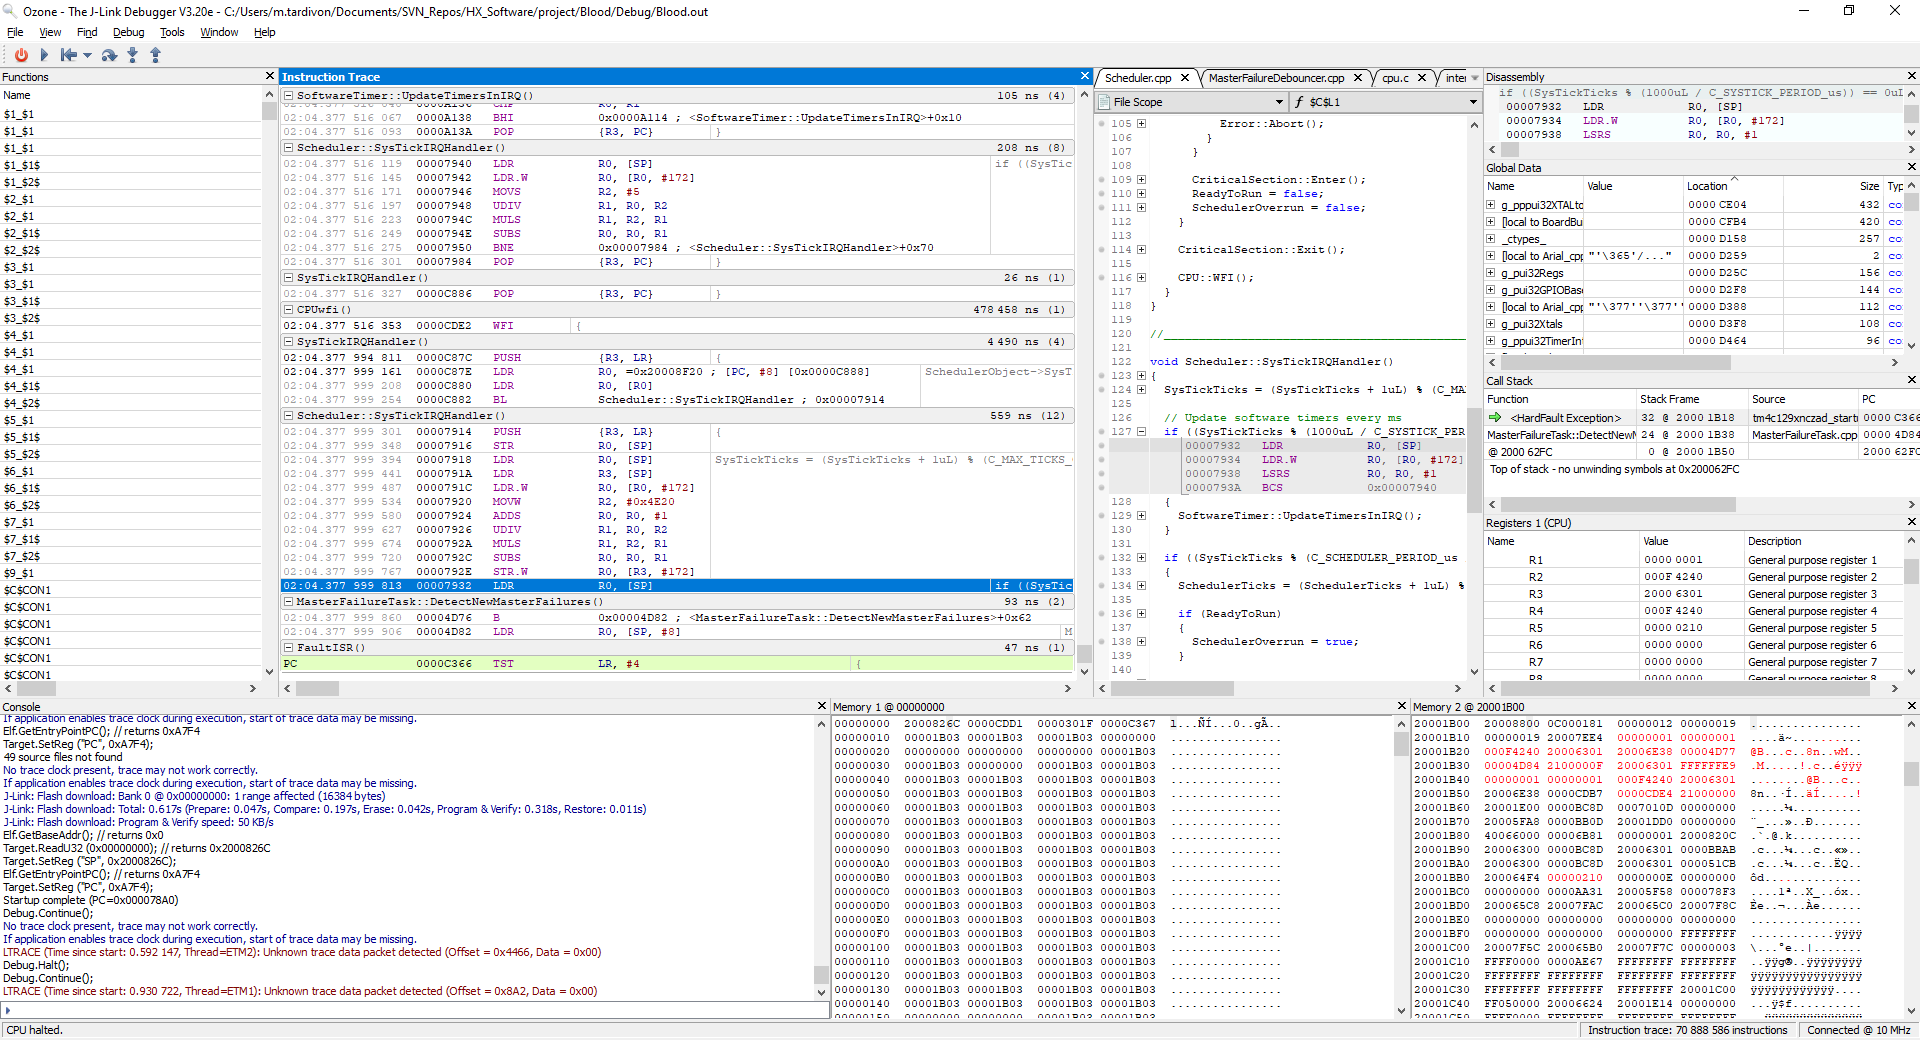
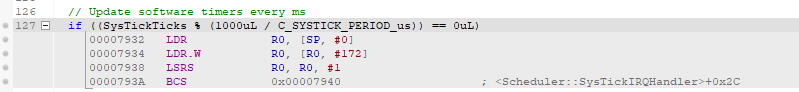
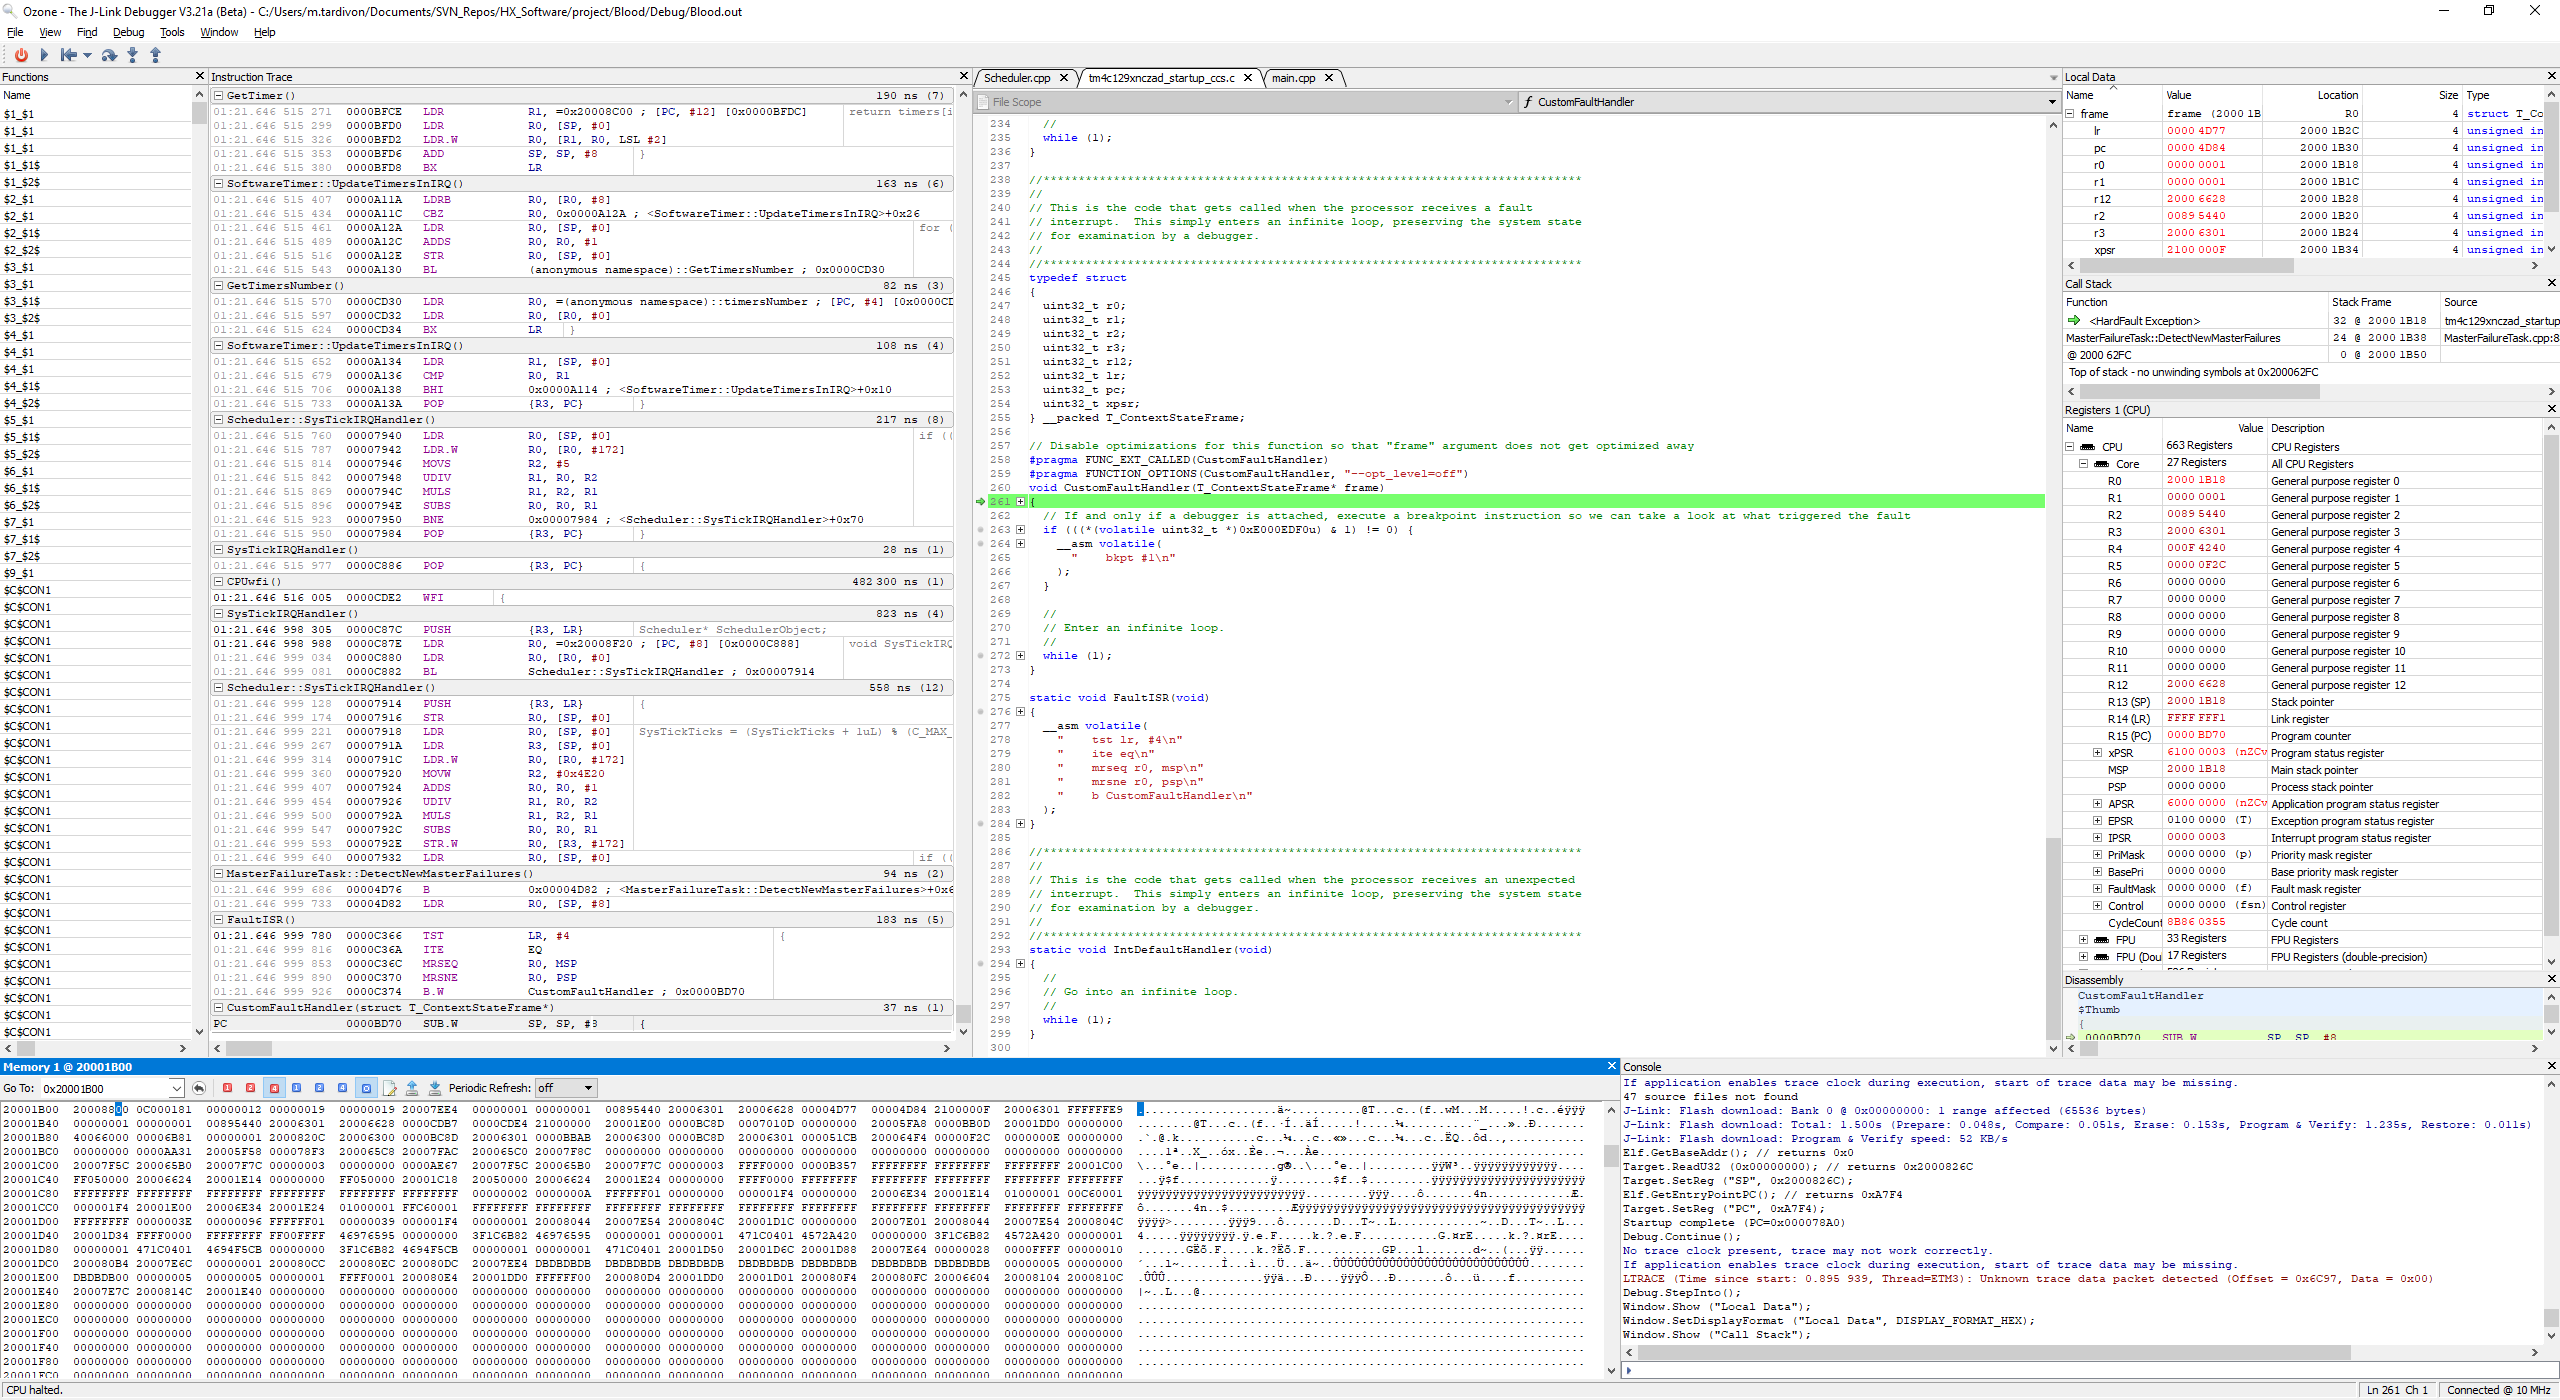
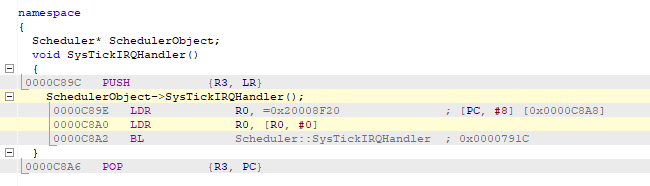
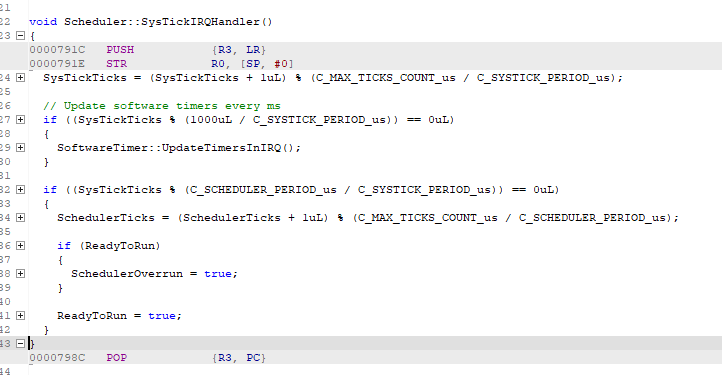
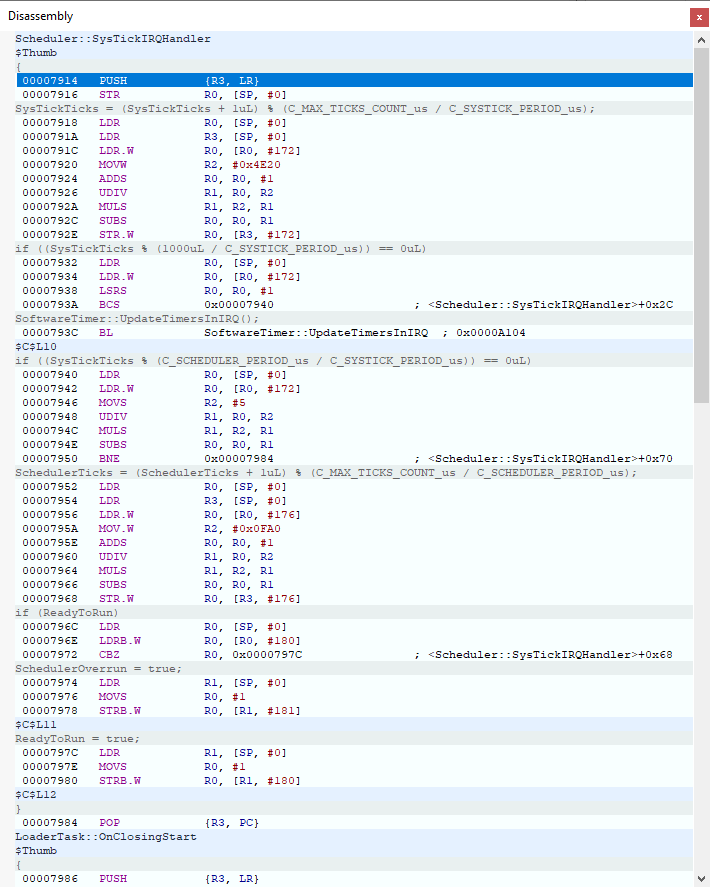
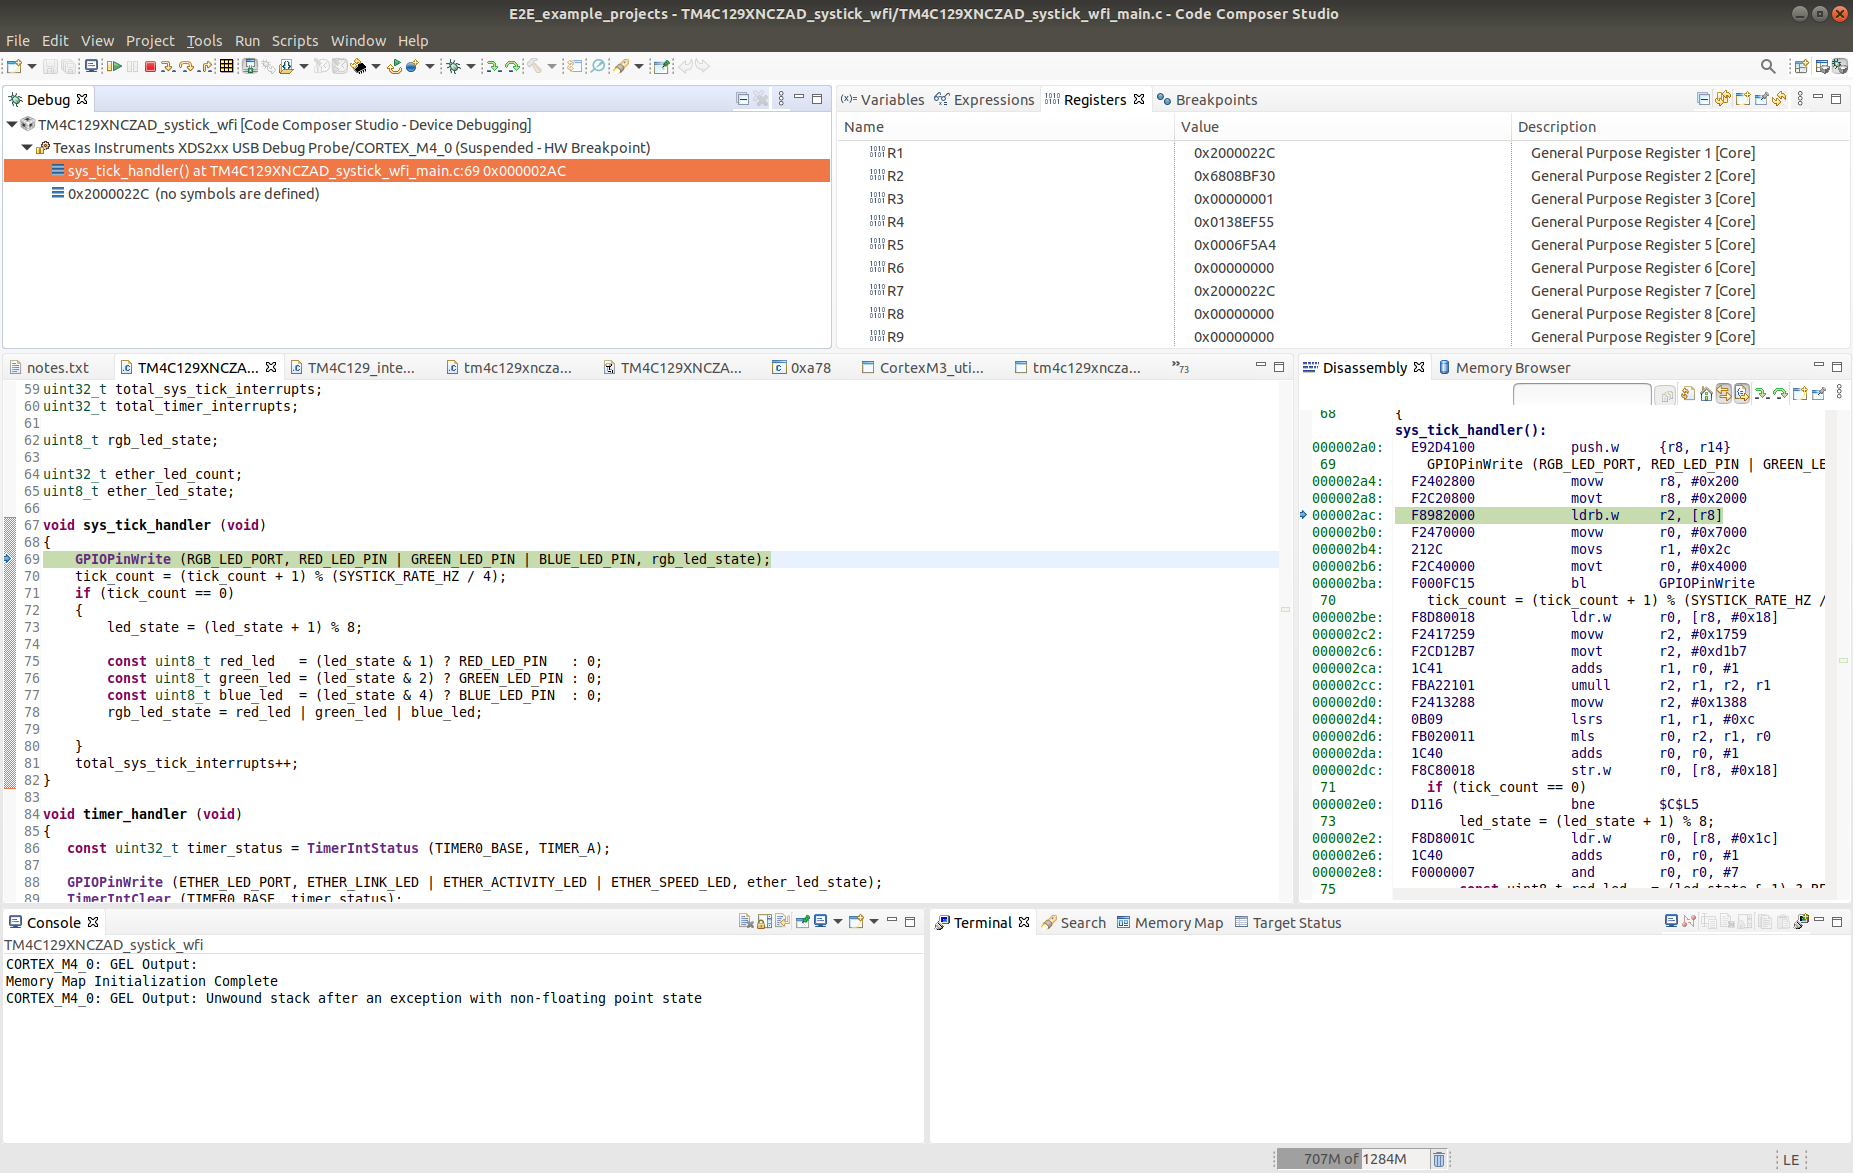
We invested in a J-Trace Pro for Cortex M and performed instruction trace and we observed the strangest behavior. At some pointer, in an interrupt handler, the PC does not simply increment after a simple register load instruction but jumps to a completely different section of the code.

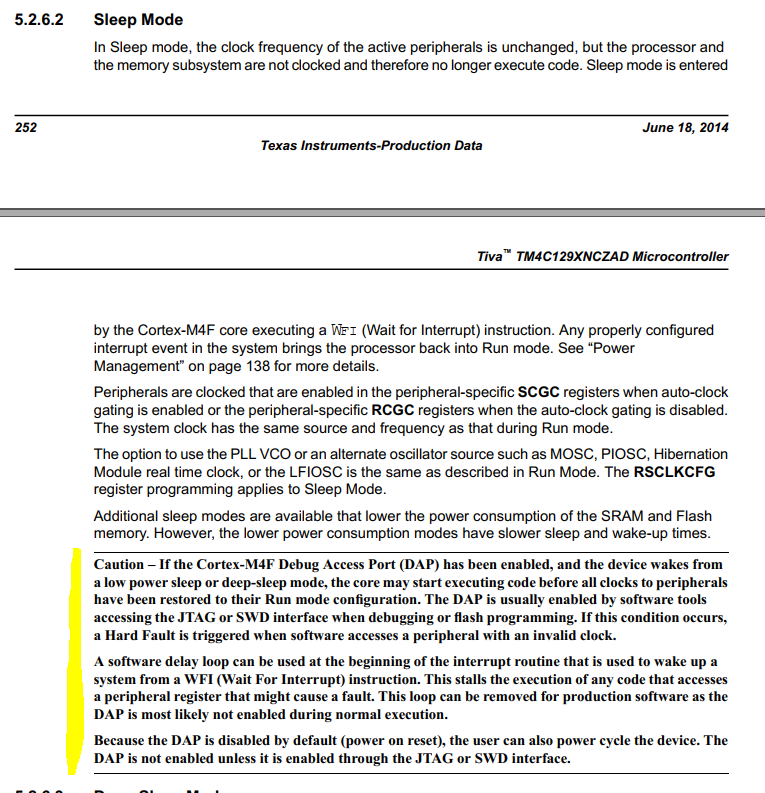
Have you ever experience such a behavior ? Is there something in the errata sheet I might have missed ?

Please find below a screenshot of the instruction trace when getting in the hardfault handler:

  • Hello Matthieu,

    Have you considered the possibility of a stack overflow here? And have you tried increasing your stack size?

    Depending if you are doing malloc's, you may also have a memory leak.

    By the way I see a scheduler.c file, is this with TI-RTOS or a different RTOS?

    Not sure if this document will help you at all too: https://www.ti.com/lit/pdf/spma043

    Section 4.4 covers another possible Bad PC situation with pointers.

  • Hello,

    We already looked for stack overflow and tried to increased our stack without any success. We used to have a stack guard (magic value) at stack top which was never changed. We now also implemented memory protection through MPU and did not get any related interrupt.

    We are developing a medical grade device, malloc is therefore forbidden.

    We have implemented our own scheduler.

    There is something you might not have seen on the trace but the instruction which triggers the fault is at address 0x4D84: LDR            R0, [R0, #12]. From the previous expression, I could see that R0 was equal to 1 and from the registers fault related flag that an invalid address access was attempted (to 0xD), triggering thus the fault.

    Anyway, the hardfault strict condition does not have much importance, what is important is to understand what indirectly led to this hardfault and from the instruction trace, the transition from address 0x7932 to 0x4D76 just doesn't make any sense and cannot be related to either our software or your compiler, it has to be hardware related.

  • Hello Matthieu,

    I agree that it is hardware related, thanks for answering questions about the stack overflow - that definitely sounds fully ruled out with your setup. And good to know about malloc & and your own scheduler for this.

    I've been looking through your screenshot provided and our Fault Diagnosis app note to try and get a better handle on this. Right now I would definitely like to understand what the FAULTSTAT register value is so I can better reference our collateral. Right now I do not see that info though it sounds like maybe you have looked into that already? If you could share details about that, it would help me.

    Couple other things...

    It looks like the function it jumps to that is in the 0x4D76/0x4D84 area is "MasterFailureTask::DetectNewMasterFailures()", is that something you have implemented? I'm not familiar with it so I'd imagine so. Is it used in the FaultISR or any other ISR handlers for TM4C?

    Also you mention the LDR            R0, [R0, #12] instruction triggers it, if so then it's still unexplained why the jump happened because the fault would then seem to be related only due to the unexplained jump (we may be on the same page here on that). Do you see any indication of PC getting loaded with a new value? Or could it be that the Fault ISR is doing that before jumping to the DetectNewMasterFailures API if that was added to the ISR?

  • Hello,

    The FAULTSTAT does not give much more information as it is consistent with the sequence of execution (invalid memory access). You can browse the different bits in the attached picture.

    Yes the MasterFailureTask::DetectNewMasterFailures() is something we implemented but it is never used in any interrupt context. In a similar way, a colleague of mine observed the same behavior but instead of the SysTickIRQHandler, the execution jumped from the USBIRQHandler to the constructor of a variable instantiated only once at the beginning of the main function.

    I don't any indication of the PC getting loaded with another value but the constant seems to be that the invalid execution jump always occurs within an interrupt context.

    We also monitored the interrupt vector, which is in RAM, but it did not change from the last interrupt register to the error occurrence.

  • Matthieu Tardivon said:
    We have been struggling with a very strange hard fault which either occurs every time after a while in the same conditions or never occurs (compile output dependent).

    Is the program performing any flash erase or program operations when the error occurs?

    The reason for asking is erasing/programing one flash bank while the code is running from a different flash bank has been seen to cause mis-execution if the flash pre-fetch buffer is enabled. See TM4C1294NCPDT: Flash write or erase issue

  • Hello Matthieu,

    Matthieu Tardivon said:
    The FAULTSTAT does not give much more information as it is consistent with the sequence of execution (invalid memory access). You can browse the different bits in the attached picture.

    Sorry, but I didn't really understand your comment last time about the address access being a memory fault at 0x0D. That piece was missing for me, and the stack trace made it look like a generic hard fault which was less telling. Understanding that this was a memory access fault was the big piece I was trying to get to so thank you.

    The Fault Status actually tells us a lot - at least from the silicon/hardware side. There are very few things which can trigger specific faults like this one.

    In this case, if a 0x82 fault for a memory access violation is almost always related to the MPU. This fault typically occurs when the MCU executes code that violates a protected memory region.

    You mentioned before:

    Matthieu Tardivon said:
    We now also implemented memory protection through MPU and did not get any related interrupt.

    Can you elaborate more on how that was setup?

    So far to this point, you've diagnosed that the culprit that triggered the fault is the below instruction, and the MMADR value of 0x0D confirms this. So trying to read the memory at 0x0D is what caused the memory access violation. 

    LDR            R0, [R0, #12].

    So now the question is why is that memory not allowed to be accessed? Is that region protected by the MPU? Is it set to execute-only?

  • Hello Chester,

    From the stack trace that is not happening, they are doing a mathematical comparison in the SysTick IRQ handler when the memory access fault occurs.

  • Ralph Jacobi said:
    From the stack trace that is not happening, they are doing a mathematical comparison in the SysTick IRQ handler when the memory access fault occurs.

    I agree that the crash occurs when the program is in a IRQ handler. However, in TM4C1294NCPDT: TM4C1294NCPDT flash write issue the issue was that when interrupts were enabled while the main thread was programming flash, then a crash could occur in an interrupt handler.

    Hence, think it is still worth trying to eliminate any flash erase/operations from leading to the crash.

  • Ralph Jacobi said:
    So far to this point, you've diagnosed that the culprit that triggered the fault is the below instruction, and the MMADR value of 0x0D confirms this. So trying to read the memory at 0x0D is what caused the memory access violation. 

    LDR            R0, [R0, #12].

    Looking at the instruction trace in the first post the trace shows the following in the Scheduler::SysTickIRQHandler() function:

    00007932 LDR R0, [SP]

    And the next instruction in the trace is the following in the MasterFailureTask::DetectNewMasterFailures() function:

    00004D76 B 0x00004D82

    It is is this unexpected jump in the instruction trace which is the problem; since the Program Counter changes from an IRQ handler in the middle of a different function.

    The fact that the LDR R0, [R0, #12] instruction at address 0x4D84 generates an address fault is just a side effect of the preceding Program Counter jump.

  • Hello Chester,

    To answer your first question, we are not performing any flash erase or write anywhere in our software, not to my knowledge at least so I'll double check that.

    And you understood perfectly the issue, the unexpected jump is the problem and the address fault is a side effect. Do you have any idea why this occurred? I have never seen such a behavior with the Cortex M4.

    To detail a little bit more the fault to Ralph:
    LDR R0, [SP] -> R0 is loaded with value 0x1
    LDR R0, [R0, #12] -> An attempt is made to load R0 with the value at address R0 + 12 = 0xD, which is an unaligned memory access but as Chester stated, it is a side effect of the unexpected jump.

  • Hello Matthieu and Chester,

    Sorry, that should have been more obvious to me.

    Can you put a breakpoint at 0x7932 and then dump the contents of the VTABLE register (0xD08) as well as the 1024 bytes pointed to by that table? From there, search that area for the value 0x4D77. If you find such a value, then it would indicate that there was some unexpected nested interrupt which is causing the issue.

    Also what is the value of SP at the time of the LDR R0, [SP] -> R0 command?

  • Hello Ralph,

    We already checked for such value in the vector table and we also checked that the vector table address did not change. SCB->VTOR = 0x20000000 as expected and no such value was found in the table unfortunately.

    SP is 0x20001B38 according to my analysis, in a valid range.

    @Chester I double check for the flash operation and did not see any, I also compared the compiled binary to the flash memory after the fault and they match.

  • Hello Matthieu,

    Curious have you tried to set CCS compiler register optimizations 0 and reduce application speed/size setting? We had random odd jumps to various invalid imprecise addresses when enabling inner procedure optimizations with Tm4C1294 MCU. Global optimizations caused odd problems too as I recall and local optimizations did not seem to cause any issues. 

  • Hi ,

    In our case, compiler optimizations are off (default) .

  • While attempting to test other features of our software, we now observe a new kind of fault, NOCP ! Could this be related?
    Our compiler has the option --float_support=FPv4SPD16

  • Hello Matthieu,

    It might. A NOCP usage fault can be generated if a floating-point instruction is executed when the floating-point unit is disabled, and the previous code which had an issue may involve floating point calculations too. Can you check if the FPU is enabled for that project? That would be a compiler setting usually. Look under Build -> Arm Compiler -> Processor Options and then see what Floating Point Support is enabled.

    That all said, I'd be a bit surprised to see that was disabled. 

    Can you show what the instructions are after address 0x00007932? It doesn't look like the trace was able to catch all of the instructions executed. One of our other experts has a suspicion that the link register was modified (corrupted) and a ret (POP {R3, PC}) caused a fault routine to execute, which then caused a hardware fault.

    Also, the value at 0x200001B3C seems very odd. What is that supposed to me? Given the SP is at 0x200001B38 that sticks out even more. It looks like it may be a corrupted value. Can you show the full register set and not just R1-R8?

  • Hi Ralph,

    Perhaps even go as far to set relaxed floating point to rule out possible FPU crashes due to odd decimal point placement errors. 

  • Hello Ralph,

    As I said, the option is --float_support=FPv4SPD16

    Here are the instructions after address 0x7932:

    The SP address I gave you was my own analysis, perhaps it is wrong, it was impossible to put a breakpoint at this precise moment as the SysTick interrupt is periodic.
    Here is a new screenshot with more information, you have all the RAM around SP and in our custom hard fault handler, we store the stacked frame (top right corner), you can see that LR=0x4D77 and you can also see all registers R0-R15. Howerever, if you take a look at the trace instruction timings, I doubt that it missed any instruction.

    Note to myself: This is software revision 3563 with trace pins configured at GPIO_STRENGTH_12MA.

  • Hello Matthieu,

    From what we are seeing, it looks like there is an unaligned 32-bit write to location 0x200063AD (R3 + #172) with the STR.W instruction at address 0x792E. This is normally allowed, but not if the “UNALIGNED” bit of the Configuration and Control register (bit 3 of address 0xE000ED14) is set.

    Can you check what the value of the Configuration and Control register is at the time of the fault?

    Another quick check just for sanity purposes... the FPU option is set in the compiler so it should be good in the code too but can you crosscheck the value for the CPAC register to see if the FPU for some reason got disabled?

  • Hello Ralph,

    UNALIGNED bit is not set and FPU is still enabled for full access at the time of the fault.

    If we think hardware, do you happen to have to internal hardware whose failure would cause such a behavior?

  • Hello Matthieu,

    Is this failure occurring across multiple units?

    If the failure is occurring on multiple units, then it would not be related to a hardware defect based on what has been presented. It's still unclear how the program flow is being corrupted to jump addresses, but there isn't a hardware flaw that is causing that from what we can see. The hardware behavior is expected based on how the software is executing and therefore it seems to be software related, though the root cause is still unclear.

    If it's only one unit misbehaving all others are working fine, then there could exist a potential that is a one-off issue with that particular device.

  • Hello Matthieu,

    Another expert reviewed all the details shared here and had some other thoughts since we are still struggling to understand the root cause.

    What is the complete disassembly of the SysTickIRQHandler()?

    There are two consecutive POP – separated by 26ns. That is unusual to see. Where are these two POP corresponding to in the SysTickIRQHandler?

    Also, looking at the timestamps, there are two PUSH instructions separated by 4490ns but only four instructions apart as shown in the trace (0xC87C to 0x7914). That makes us feel that some instructions are not being traced out fully.

    Check if there is a way to increase the trace buffer on the J-Trace and maybe that can provide a better picture.

    Lastly, can you also try to disable nested interrupts as an experiment to see what behavior occurs?

  • Ralph Jacobi said:
    That makes us feel that some instructions are not being traced out fully.

    The Ozone screen capture shows a WFI instruction traced approx 1300 ns before the trace shows the suspect jump.

    While looking into cortex-M ETM trace, I found the QTRACE - USER MANUAL contains the following recommendation:

    Avoid using functions that execute WFE/WFI sleep instructions as this will cause trace output to be suspended and will lead to erratic tracing behaviour. It is recommended to comment out WFE/WFI instructions for builds to be used for tracing. The QTrace Analyser will detect if these instructions are being used and will highlight their location(s).

    If there is no associated source for the WFE/WFI instruction e.g. it is located in a library file, then the WFE/WFI instruction will need to be patched with a NOP instruction. See Appendix C NoSleep Utility for details of the NoSleep utility that can patch WFE/WFI instructions.

    While this recommendation is not from the Segger J-Trace Pro for Cortex M documentation, it might be worth trying to remove the WFI to see if the trace capture then contains more instructions around the failure.

  • Hello,

    First of all, thank you for support and all your comments, I will try to answer them all.

    Yes, the error occurs across multiple units. However, though we followed all the system design guidelines, we can't exclude any error in our hardware design. It is really hard to determine if the root cause is only hardware/software related or a little bit of both.

    Regarding your push/pop remark, it corresponds to the following code below. Two functions are imbricated, hence the two push/pop pairs. We had to implement a wrapper in order to use the IntRegister functions from TivaWare as you need to pass a function pointer but to execute a non static method in C++, you also require the object. Though the timing seems odd from J-Trace, I am not sure that it means we lost any instruction in the trace, it might be linked to the WFI instruction as stated Chester.

    I can remove WFI instruction and interrupt nesting. However, as I mentioned at the beginning, there will still be an hard fault but without the same kind of jump or even the same source as the failure is always the same for one given binary but is binary dependent.

    Best regards,

    Matthieu

  • Hello Matthieu,

    Matthieu Tardivon said:
    I can remove WFI instruction and interrupt nesting. However, as I mentioned at the beginning, there will still be an hard fault but without the same kind of jump or even the same source as the failure is always the same for one given binary but is binary dependent.

    The intent here is that the resulting information of the stack trace related to the fault will be easier for us to use to help figure out the root cause. Right now with all of that going on it's hard to gauge what is working as intended vs suspect behavior.

    Also for SysTickIRQHandler, we are looking for the full disassembly for it, not the C code. If you need help pulling that info I can provide guidance.

  • Hello Matthieu,

    One other thought here...

    You mentioned using IntRegister, and you have a scheduler setup. Are you basically running a custom RTOS? And if so, how are you managing the NVIC and Vector Table relocation?

    The reason for that ask is that at least with TI-RTOS, the IntRegister API causes issues where it will mess up the Hwi of the RTOS: https://e2e.ti.com/support/microcontrollers/other/f/908/t/849627?tisearch=e2e-sitesearch&keymatch=faq%3Atrue

    May not be applicable for your case, but another possible area to investigate.

  • Hello Ralph,

    Here is the full disassembly of the SysTick function (without the wrapper):

    I also provide you with the .out with full symbols so that you can also browse disassembly if you want. (Had to put it in .7z format)https://e2e.ti.com/cfs-file/__key/communityserver-discussions-components-files/908/Blood.7z

    We use IntRegister because it is easier to implement generic drivers but our scheduler is very simple and nothing like an RTOS so this thread does not apply to us.

    Best regards,

    Matthieu

  • I also tested Chester idea and removed the WFI instruction and our program ran all night without any fault. So, I did some digging in the datasheet and I came across this section and especially the "Caution" paragraph.

    I think this could be related to the observed issue. What do you think about it?

    I also checked our clock gating and we set the RCGC registers using SysCtlPeripheralEnable function and we never enable the auto clock gating so the peripherals are supposed to be clocked, even during the WFI instruction. Therefore I don't understand why this would trigger a hardfault. However we did start to observe the issue when we implemented more hardware related features and added some floating point calculation in the interrupt so this seems to be definitely related to our issue.

    I also performed a test where I put back the WFI instruction but also set the SCGC registers using the SysCtlPeripheralSleepEnable function and enabled the auto clock gating using SysCtlPeripheralClockGating function. This software has also been running for hours without any fault.

    If you think this is related to our issue, could you provide us with detailed information of what physically happens within the microcontroller in these different cases in order to help us have a better understanding of the issue?

    Best regards,

    Matthieu

  • Hello Matthieu,

    I think this could be getting us down the right path, but it is strange to me that if you have the RCGC registers set, that you would have that issue.

    Honestly we aren't quite sure why that combination of settings and conditions would cause a fault.

    One thought we had, is the DMA being used at all? The idea being in that case that DMA tries to access the memory subsystem while the device is in sleep mode.

    Do you think you could figure out which of the two caused an issue more between floating point and hardware features?

    The NOCP error sticks out to me for the FPU... but there shouldn't be a reason the FPU needs a delay after the WFI to work. At least not to our understanding of how a Cortex-M4F is architected.

  • Matthieu Tardivon said:
    I think this could be related to the observed issue. What do you think about it?

    The caution in the datasheet suggests the hard fault would occur when attempt to access a peripheral register after waking up. However, in your case the hard fault didn't seem to be accessing a peripheral, but rather as a result of a spurious program branch. MSP432E401Y: WFI() causes hard fault running lwIP is an example of where a WFI caused a hard fault on accessing a peripheral register after waking up (while that referenced thread is for a MSP432E device, the MSP432E uses the same peripherals as a TM4C129).

    Also, the caution in the datasheet says the problem would only occur when waking up when the DAP has been enabled, which in normally only when the debugger is attached. I assume your program doesn't enable the DAP. Have you observed the failure when the debugger wasn't attached?

    Searching the forum for "WFI" found the old Random Hard Faults on Wakeup from WFI Instruction (LM3S6918 Running at 50 MHz), which while is for an obsolete Stellaris device rather than a TM4C129 the failure mode seems to match. In that referenced thread there was an errata in some Stellaris devices where the flash controller could sometimes feed garbage instructions to the processor after wake up. Will attempt to create to create a program for a TM4C129 which spends most time in sleep (using a WFI), just waking up with a timer interrupt at a high rate, to see if can create a failure.

  • Hello,

    Thank you both for your feedback.

    To answer Ralph's question, we do use DMA for UART sending but I doubt that this might be linked to our issue as it would more probably cause a data corruption in the transfer similarly to the errata sheet case in deep-sleep mode rather than a hard fault. I unfortunately don't think that I will be able to determine which of the two caused an issue more between floating point and hardware features, it is very hard to say. But indeed the FPU and the WFI are only ARM related and there are no known bugs about such issue so this is quite weird.

    To answer Chester question, we almost always have a debugger attached and our software does not enable explicitly the DAP (unless hidden in TivaWare but I doubt it). One of my colleague said that he observed a freeze without a debugger attached and after a power cycle and thought it was linked to the same issue but it is quite hard to know as we can't have the trace at that moment.

    Nonetheless, I really believe that we are close to something as both following solutions seem to fix the issue:
    - Removing the WFI instruction
    - Keeping the WFI instruction and use SCGC clock gating and auto clock gating

    So the issue definitely seems related to MCU sleep mode. We need know to understand exactly the source of the problem in order to be sure that one of these solutions is the correct workaround and does not just hide temporarily the issue.

    Thank you again for your support !

    Best regards,

    Matthieu Tardivon

  • Chester Gillon said:
    Will attempt to create to create a program for a TM4C129 which spends most time in sleep (using a WFI), just waking up with a timer interrupt at a high rate, to see if can create a failure.

    The attached project is for a TM4C129XNCZAD which has been seen to generate a hard fault in an interrupt handler. The overview of the test is:

     * @details The test is organised as a bare-metal program in which:
     *          a. The main thread spins a loop using a wfi instruction to put the processor to sleep,
     *             and just increments a global variable even time woken up by an interrupt.
     *          b. A systick timer handler which toggles some LEDs, where the systick timer runs a fixed rate.
     *          c. A timer0 handler which toggles some LEDs. The timer period is swept through a range to attempt to "beat"
     *             with the systick timer.
     *          d. The interrupt handlers write to the GPIOs for the LEDs every time they are called, with the LED state changed
     *             at a slower rate to give a visible flash.
     *
     *          The target board is a "mikromedia 5 for Tiva C Series"

    The hard fault has only been seen to occur when the debugger is attached (a XDS200), running under CCS 10.1.1.

    1. If start a debug session under CCS then within 12 seconds of running enters a hard fault. Example of where the hard fault occurred (using the GEL script from CCS/TM4C1294KCPDT: How do I get the stack unwound in exception handlers? to unwind the stack after the hard fault):

    When the hard fault occurs the offending instruction is always at address 0x2AC. When that instruction is executed R8 should have the constant value of 0x20000200, but the register R8 has the value 0x0 at the time of hard fault. The NVIC_FAULT_STAT register is 0x00008200, which has the NVIC_FAULT_STAT_BFARV  (Bus Fault Address Register Valid) and NVIC_FAULT_STAT_PRECISE (Precise Data Bus Error) bits set. The NVIC_FAULT_ADDR register is 0x0138EEA5, but from the disassembly and register dump there was no instruction which appeared to be accessing address 0x0138EEA5.

    Also, the tests sweep the period of the timer0 though a range of values, and when the hard fault occurs the timer_period is normally 5925, but one saw the value of 5923 when the hard fault occurred.

    2. If the target is powered-cycled, leaving the XDS200 connected but not running a debug session, then the test continues to run. Left for one hour or four hours on two runs. With the target running attached the debugger and then resumed running. Within several seconds the hard fault occurred.

    This points at some interaction with the use of wfi to place the processor in sleep when the DAP is enabled due to the debug session being attached.

    I haven't yet tried changing things to see what makes the problem go away when the DAP is enabled.

    The TM4C129XNCZAD used had the DID0 value of 0x100A0002 which means Part Revision 3.

    TM4C129XNCZAD_systick_wfi.zip

  • Chester Gillon said:
    The hard fault has only been seen to occur when the debugger is attached (a XDS200), running under CCS 10.1.1.

    I tried using a Segger J-Link instead of a XDS200 and the same hard fault occurred when a debug session was active. Also, the test with the XDS200 was CCS 10.1.1 under Linux, and the the test with the Segger J-Link was with CCS 10.1.1 under Windows 10.

  • Chester Gillon said:
    I haven't yet tried changing things to see what makes the problem go away when the DAP is enabled.

    Found the following sequence is repeatable:

    1. Start a debugging session. With the program halted at main, in the Registers view set the FLASH_CONF_FPFOFF bit in the FLASH_CONF register. This forces the flash prefetch buffer off.

    2. Run the program, with the DAP enabled, which runs without error.

    3. Pause the program, and in the Register view clear the FLASH_CONF_FPFOFF bit. Upon resuming the program then get the same hard fault in the sys_tick_handler as when run the program without changing the FLASH_CONF_FPFOFF bit.

    Not sure if either:

    • Forcing off the flash prefetch buffer, which will slow down code execution from flash at the 120 MHz CPU clock used, changes the timing which masks the cause of the hard fault.
    • It is having the flash prefetch buffer enabled which causes the hard fault when the processor wakes up from sleep following a wfi. The flash prefetch buffer could be providing incorrect instructions.

  • Hello Chester,

    Thank you very much for your feedback. I also performed a test on my side and took the project you provided. I had to modify it just a little to use other GPIOs but it did trigger a hardfault on our target as well.

    Then, I configured and enabled the trace pins and the program would not crash anymore....

    After that I added a float multiplication at the beginning of one of your interrupt and a float division at the beginning of the other and .... drum roll .... I had a hardfault with NOCP bit set ! So this seems definitely related to our issue and what we observed. The stack frame in the hard fault context does correspond to a float operation.

    Best regards,

    Matthieu

  • Hello Matthieu and Chester,

    Thanks for this great progress on the issue. I have download Chester's project but I haven't had the chance yet to run tests with it. I should be able to do so tomorrow. I will be testing primarily with Stellaris ICDI and XDS200. I do have a J-Link if that is needed too but right now it seems like the XDS will be sufficient to see the issue.

  • Hello Matthieu and Chester,

    Thanks for the patience here.

    I ran a set of tests with my DK-TM4C129X board and an XDS200 in order to re-create what Chester has observed.

    There does seem to be a strange relationship between WFI, DAP, and Flash Pre-fetch, though what exactly is going on is still a bit unclear to me. However, right now I am leaning towards the idea that turning off pre-fetch is 'solving' the issue by making the code execute slower.

    As the datasheet mentioned short delays after the WFI would avoid issues, I went ahead and added 10 NOP commands at the start of both ISR's and directly after the WFI command. Currently, this code has been running over an hour now, and I intend to run it overnight. Previously it took seconds to fail.

    I did test locations on these, and I found I needed them in both the ISR's and after the WFI command. I did not test if both ISRs need them yet or just one ISR, but I would anticipate both.

    I also haven't tested yet how many are required. I chose 10 as an arbitrary number and it worked, and I am most interested in the extended test results now given how quickly the rest can be fine-tuned tomorrow.

    So based on these results, it makes me think that the Flash Pre-fetch being turned off is effectively functioning as these NOP commands to give the MCU enough time to fully recover from the WFI.

    I am not sure if the issue itself really falls under what the datasheet describes, if FPU operations are triggering this, or the Flash Pre-fetch is able to solve it, then I don't think 'peripheral access' is a sufficiently broad statement to encompass all the events that seem to be triggering the faults.

    I am waiting feedback from my teammates and will continue to do more tests tomorrow, but right now I anticipate that our recommendation will be to insert a few NOP statements after the WFI command and at the start of any ISRs that could wake the device from WFI. As the datasheet mentions, those could be removed for production.

    Also, Stellaris ICDI doesn't have any issues at all since it's debug interface does not actually access the DAP, which further indicates that the issue is directly related to how the DAP and WFI play together since the CCS debug environment is being replicated in that case vs having the board free running outside of the debug environment.

  • Hello Matthieu,

    Sorry for the silence for a couple days, had a lot of tests to run and there was a lot of unusual results to sift through. You might want to refill your drink before starting to read this haha. Hopefully what we have discovered and can provide is sufficient for your situation.

    To start, here is the hardware I have been testing with:

    DK-TM4C129X Development Kit, which I will refer to as the 'DK board' throughout

    EK-TM4C1294XL LaunchPad, which I will refer to as the 'LaunchPad' throughout

    XDS200 Debugger

    Software, I have been largely using Chester's provided example which I also ported to the EK-TM4C1294XL.

    There are four elements in play here total from what I have seen. The DAP, the WFI, the pre-fetch, and to the least extent, compiler optimizations.

    When I started initially, I was focused primarily on the DAP and WFI piece, and even with the last post I made, I hadn't really uncovered what is going on deep enough to really understand what was happening compared to now. So a lot of what I will say here will go against my last findings because they were incomplete.

    First off, the amount of NOP's needed to avoid the issue would be at least 9 at the start of each ISR, and after the WFI. Much higher than anticipated. At the time of doing the tests however I noticed a few strange circumstances:

    1) The ICDI did not have any failures

    2) Disconnecting the XDS200 probe entirely when the NOPs were not used would result in the issue still occurring on device reset

    Furthermore, one of my teammates was suspicious of pre-fetch based on previous experience with how it works on other MCUs they supported in the past. So I did some further tests to try and validate if the issue is purely due to the pre-fetch executing slower, or if the pre-fetch itself was causing the issue.

    To do this, I tried aligning the code to 32 byte segments in the linker command file for the DK board and then also observed what happened when executing from RAM. Aligning all the code did not help, but the executing from RAM resolved the issue which indicated that the DAP and WFI wasn't the sole issue, but something about how they work with Flash memory was part of it.

    That lead to another test with aligning the code where the WFI command was placed in a function in a dedicated file, and just that file was aligned to 32 bytes in the linker command file. With that setup, the DK board worked properly again regardless of the DAP and the pre-fetch buffer.

    That still left a curiosity though in why the ICDI did not have any failures. So using the XDS200, I went to the LaunchPad and tried to see if the LaunchPad would fail with the XDS200 only. And it did not. Which was not expected because the only change I made was to adjust one GPIO port for LEDs.

    After digging further into the project properties, I saw that Chester had optimizations cranked to max speed. Once I applied the same level of optimizations to the LaunchPad project, then it immediately began to fail and it failed for both the XDS200 AND the ICDI now.

    This is where it got even stranger though. We had seen that if the XDS200 was disconnected or removed, that the issue would occur and that repeated on the LaunchPad. But when the ICDI was disconnected, the code ran perfectly again. In both cases, I was resetting the boards with the Reset button on the board. Then with the LaunchPad after programming with the XDS200 again, disconnecting it, resetting, and getting the failures... I power cycled the board by pulling the USB cable and the code worked fine with the power cycle.

    So... now to start summarizing key points.

    1) Aligning the WFI to 32 bytes solves the issue

    2) Turning off pre-fetch solves the issue

    3) Using a sufficient number of NOPs after waking from WFI solves the issue

    4) Lowering optimizations either gets rid of or masks the issue

    5) The DAP is leaving some sort of residual debug logic that requires a full power reset to clear up

    Based on these, it would appear that when the WFI wake up occurs with the DAP enabled, the pre-fetch logic in the device has an error occur which then triggers the device to hard fault. By delaying with NOPs, the prefetch error is given sufficient cycles to clear up before the memory accesses are done. But by forcing the WFI command to be aligned to a 32 byte segment which puts it as the first two bytes of the 32 byte prefetch buffer, then the pre-fetch works correctly without any errors.

    Unfortunately because we don't actually have a way to understand what the DAP is doing that the ICDI is not which is persisting in the device to cause the issue, I would not say we truly have a root cause understood here in terms of why the DAP is impacting the pre-fetch and why it requires a power cycle to clear the settings that generate this issue. But this information at least gives us a solution that we have high confidence in, which is the WFI alignment.

    By using the WFI alignment solution, you won't need to turn off pre-fetch, you don't need to finetune NOPs or add them to ISRs (which means you won't have to worry about forgetting one), and you can keep high optimizations in your code safely.

    I am attaching the CCS project where the alignment has been done for the WFI. One note I'll make is we did include two NOPs after the WFI command based on the recommendation of one of our experts who said that was a good practice based on our Hercules devices. It is not required for the solution to this, but it has been left in as a good practice.

    You will see in the .cmd how the alignment was achieved so hopefully you can replicate that in your program.

    CCS Project: TM4C129XNCZAD_systick_wfi (2).zip

    Let me know if you feel this is sufficient information to close the issue on your side if the WFI alignment solution works.

  • The attached project is my example which has been ported to run on a EK-TM4C129EXL, and shows the failure when used with the ICDI (for the attached project have not forced the alignment for wfi which is at address 0x00000574).

    Aligning the wfi to a 32-byte boundary stopped the hard fault when run under the debugger.

    I found another way to stop the hard fault which was to:

    1. Start a debug session
    2. With the program halted at main use the debugger register view to change the SYSCTL_SLPPWRCFG FLASHPM field from 0x0 (Active Mode) to 0x2 (Low Power Mode).
    3. Resume the program, which no longer suffers a hard fault

    Does changing the act of changing Flash Power Mode which stops the hard fault give any clue about the root cause?

    Would it be worth adding a device errata for this issue?

    TM4C129ENCPDT_systick_wfi.zip

  • Hello Chester,

    Chester Gillon said:
    Does changing the act of changing Flash Power Mode which stops the hard fault give any clue about the root cause?

    I'm not sure... my first thought is that when the Flash is in low power mode, part of the slower execution is that it doesn’t try and optimize accessing Flash where instructions end up being split and therefore ends up inadvertently aligning the memory like align(32) so the issue doesn’t occur.

    Chester Gillon said:
    Would it be worth adding a device errata for this issue?

    It is something we are considering, the problem is that we don't really understand the root cause. Also that it is dependent on Optimizations is a bit of a catch too because those will vary across IDEs. I think it qualifies but we need to figure out exactly how to present the issue in a meaningful way.

    Honestly I wonder at this point if the device datasheet warning for WFI just was a misunderstanding of the issue and it was never about peripheral access, but that it seemed to be related to peripheral access since an ISR would usually start with peripheral calls.

  • Hello Ralph and Chester,

    First of all thank you very much for all you work, this is of great help and I am sorry for the late response.

    I have been running some tests on my side with the projects you provided on our target and I can confirm two things with this specific project:

    - Using the align 32 for the WFI instruction does seem to prevent the hard fault

    - Using SCGC and auto clock gating does not prevent the hard fault

    However, I have been trying to apply the "align 32" on our target and unfortunately I have been facing hard fault, I will need a little bit of time to determine if they are related or come from a completely different issue.

    In the meantime, can you confirm that I implemented the fix correctly on the attached patch (renamed in .txt for attachment authorization)?WFIAlign32.txt

    I believed that it would be nice to have it on the errata sheet once the root cause is fully understood indeed. I was also wondering if the "align 32" is a linker directive/attribute that can be directly applied to a function, if it is the case, it could be nice to apply it to the CPUwfi function in TivaWare and add the two NOP instruction at the same time. I also put the drive strength change for the trace pins as I would also recommend to update the value in TivaWare as well.

    Best regards,

    Matthieu Tardivon

  • Matthieu Tardivon said:
    In the meantime, can you confirm that I implemented the fix correctly on the attached patch (renamed in .txt for attachment authorization)?WFIAlign32.txt

    The fix needs to ensure that the wfi instruction is aligned on a 32-byte boundary.

    The patch shows the linker command file has been changed to align the start of the CPU.obj file on a 32-byte boundary:

        .wfi  align(32) : {CPU.obj (.text)} > FLASH

    Since the CPU.cpp source file contains more than one function, and CPU::WFI() has a call to CPUwfi() that means the actual wfi instruction which is the first instruction in CPUwfi() has not been given explicit 32-byte alignment. I.e. the alignment of the wfi instruction will likely change when other parts of the program change and still result in a hard fault.

    The CPUwfi() function from TivaWare is placed in its own section, and the following can be added to the linker command file to place the start of the CPUwfi function at a 32-byte boundary:

    	.text:CPUwfi align(32) : {} > FLASH

    Matthieu Tardivon said:
    I was also wondering if the "align 32" is a linker directive/attribute that can be directly applied to a function

    I found the TI ARM compiler user's guide mention a CODE_ALIGN pramga which could be specified in a source file, but found that the pragma didn't work - see Compiler/TM4C129XNCZAD: TI ARM v20.2.3.LTS compiler doesn't seem to support code alignment

  • Hello Matthieu,

    Was Chester's instructions useful for you to understand how to use the align(32) for your code better?

    Matthieu Tardivon said:
    I believed that it would be nice to have it on the errata sheet once the root cause is fully understood indeed. I was also wondering if the "align 32" is a linker directive/attribute that can be directly applied to a function, if it is the case, it could be nice to apply it to the CPUwfi function in TivaWare and add the two NOP instruction at the same time.

    The issue of understanding the root cause precisely is what we are running up against as this sort of behavior is very hard to precisely track down.

    Regarding the linker directive, see my comments to Chester near the bottom of this.

    Matthieu Tardivon said:
    I also put the drive strength change for the trace pins as I would also recommend to update the value in TivaWare as well.

    Sorry, this thread has been very long and maybe I missed this. Can you explain this request further? I can evaluate and submit for future updates if it checks out on our end as a good universal change.

    Matthieu Tardivon said:
    - Using SCGC and auto clock gating does not prevent the hard fault

    Thanks for the input with this, that is very helpful for us as we continue to assess what precisely is causing the issue here.

    Hi Chester,

    Chester Gillon said:
    I found the TI ARM compiler user's guide mention a CODE_ALIGN pragma which could be specified in a source file, but found that the pragma didn't work - see Compiler/TM4C129XNCZAD: TI ARM v20.2.3.LTS compiler doesn't seem to support code alignment

    Thanks for opening this E2E thread. Bob had made the same observation though we did not go back to the compiler thing regarding it. Maybe a bit too tunnel visioned on the issue at hand! Hopefully there will be a future resolution for them which would make this easier... I will track the internal systems for that bug report and if I see a resolution to fix the issue then I will reflect that we should update TivaWare to use that moving forward.

  • Hello Ralph and Chester,

    Chester's explanation did indeed help me to understand how to do the fix. The fixed software has been running for more than 24 hours without any fault.

    I discussed with our software team and we have decided to add this fix in to trunk and mark this issue as resolved. As much more tests will be performed with this fix, if we see any related hard fault, we'll come back to you on this thread or another with a reference to this one.

    Regarding the trace pin drive strength, it was the only way for me make the trace work as we have quite long ribbon cables and an isolator in the middle. This is also a recommendation from Segger: "Pattern test successful but still incorrect trace data? Check the set pin drive strength in your pin initialization and set it to highest/fastest possible and check if a lower trace clock (slow down the CPU clock speed in your PLL init) solves the issue"
    https://www.segger.com/products/debug-probes/j-trace/technology/setting-up-trace/

    Once again, thank you very much to both of you for your support, we hope that you will be able to find the root cause behind and we are looking forward to hearing about it!

    Best regards,

    Matthieu Tardivon

  • Ralph Jacobi said:
    I am attaching the CCS project where the alignment has been done for the WFI. One note I'll make is we did include two NOPs after the WFI command based on the recommendation of one of our experts who said that was a good practice based on our Hercules devices. It is not required for the solution to this, but it has been left in as a good practice.

    A search found the TI application note for the Cortex-M MSP432 Proper Sleep and Interrupt Use on the SimpleLink™ MSP432™ ARM® Cortex® -M4 Microcontrollers which describes the need to use a Data Synchronization Barrier (DSB) instruction to flush the data memory transfer pipeline prior to going to sleep to avoid unexpected behaviour.

    And ARM Application Note 321 ARM Cortex-M Programming Guide to Memory Barrier Instructions contains the following in section 3.3 Architectural Requirements:

    Sleep

    It is not a requirement for the processor hardware to drain any pending memory activity before suspending execution to enter a sleep mode. Therefore, software has to handle this by adding barrier instructions if the sleep mode used could affect data transfer. A DSB should be used to ensure that there are no outstanding memory transactions prior to executing the WFI or WFE instruction.

    Based upon that loop my example for the EK-TM4C129EXL was changed to add a dsb prior to the wfi instruction:

        for (;;)
        {
            asm (" dsb");
            asm (" wfi");
            num_wakeups++;
        }

    From the disassembly the wfi is not 32-byte aligned:

              $C$L9:
    00000574:   F3BF8F4F            dsb        sy
    00000578:   BF30                wfi        
    153               num_wakeups++;
    0000057a:   6808                ldr        r0, [r1]
    0000057c:   1C40                adds       r0, r0, #1
    0000057e:   6008                str        r0, [r1]
    154           }
    00000580:   E7F8                b          $C$L9

    With just the insertion of the DSB instruction, i.e. not adding explicit alignment of the wfi instruction nor adding any trailing NOPs, the hard fault is no longer occurring. 

    Not sure if adding the DSB has fixed the root cause, or just changed the timing to mask the problem.

  • Hello Chester,

    This is interesting news. I was about to write in this thread as I distributed the fix to our SW team and unfortunately, two of my colleagues has the hard fault occurring and our analysis show that they were related to the same issue. Therefore the WFI instruction 32 bits alignment does not seem to be sufficient to fix the issue.

    I have also came across this post:
    https://stackoverflow.com/questions/47022456/why-is-an-isb-needed-after-wfi-in-cortex-m-freertos

    I also found the following recommendation:
    "A DSB should be used to ensure that there are no outstanding memory transactions prior to executing the WFI or WFE instruction. "
    and many explanations which can be found in "Application Note 321 ARM Cortex-M Programming Guide to Memory Barrier Instructions"

    Most of our team is going on vacation today but we will perform new tests as soon as possible beginning of next year.

    Best regards and merry christmas,

    Matthieu Tardivon

  • Chester Gillon said:
    Not sure if adding the DSB has fixed the root cause, or just changed the timing to mask the problem.

    The ARM Application Note 321 shows that the architectural requirement for the DSB is to ensure that a buffered write has completed before the clocks are stopped:

    To try and understand if the DSB was fixing the root cause:

    a. Downloaded the original program for the EK-TM4C129EXL which fails.

    b. With the program stopped at the start of main(), used the debugger to set the NVIC_ACTLR_DISWBUF bit in the NVIC_ACTLR register, which disables the write buffer.

    The hard fault still occurred. I.e. don't believe adding the DSB has fixed the root cause, but rather just changed the timing.

  • Hello Chester,

    Thanks for this new information.

    Chester Gillon said:
    With just the insertion of the DSB instruction, i.e. not adding explicit alignment of the wfi instruction nor adding any trailing NOPs, the hard fault is no longer occurring. 

    Not sure if adding the DSB has fixed the root cause, or just changed the timing to mask the problem.

    I tried doing the same and did not have your result.

    I am not sure the Write Buffer piece is what the DSB is really impacting here. It could be instead that it is influencing the behavior of the prefetch buffers which is involved as part of the root cause for this issue along with the DAP and WFI.

    What I find more interesting from the app note is also the use of the SCB_SCR_SLEEPONEXIT_Msk and SCB_SCR_SLEEPDEEP_Msk.

    For TM4C the equivalents are:

    //*****************************************************************************
    //
    // The following are defines for the bit fields in the NVIC_SYS_CTRL register.
    //
    //*****************************************************************************
    #define NVIC_SYS_CTRL_SEVONPEND 0x00000010  // Wake Up on Pending
    #define NVIC_SYS_CTRL_SLEEPDEEP 0x00000004  // Deep Sleep Enable
    #define NVIC_SYS_CTRL_SLEEPEXIT 0x00000002  // Sleep on ISR Exit

    These are also detailed in Register 59: System Control (SYSCTRL), offset 0xD10 of the datasheet.

    However when I tried using these, I had even worse performance... so I am not sure why recommendation would work for MSP432 so much better. Especially if the app note is written with MSP432E4 in mind.

    Matthieu,

    No problem about the holiday break, I am out all next week as well and working in a more limited capacity the week after. I think picking this up at the start of the year will be best for all.

    I'd be curious to know both how the DSB impacts your system as well as following the MSP432 guidelines closely. Presumably that app note is written with the MSP432E4 in mind too which uses the same architecture as TM4C so I would replicate the commands for TM4C exactly as ordered and see what occurs. That said, based on my own results... my expectation is that it will not have an impact to solve the issue. TM4C equivalent code below:

            HWREG(NVIC_SYS_CTRL) |= NVIC_SYS_CTRL_SLEEPDEEP; // Set SLEEPDEEP
            HWREG(NVIC_SYS_CTRL) |= NVIC_SYS_CTRL_SLEEPEXIT; // Set SLEEPONEXIT
            asm (" dsb"); // Ensures SLEEPONEXIT is set immediately before sleep
            asm (" wfi");
    

    For the systems which have the issue, have your engineers tried disabling the prefetch buffers as a solution? Obviously we want a better solution than that but it would be a good data point to know if that solves the issue across all systems for you.

  • Ralph Jacobi said:
    I am not sure the Write Buffer piece is what the DSB is really impacting here. It could be instead that it is influencing the behavior of the prefetch buffers which is involved as part of the root cause for this issue along with the DAP and WFI.

    I agree the test is inconclusive. The issue with failures such as these, where as Matthieu notes the failure can come-and-go as the code is changed, is to find the root cause.

    Given some of the examples which show a failure after a number of seconds on a device by just using timer interrupts and GPIO toggles, i.e. without any dependencies on external inputs, do TI have the ability to run a cycle-accurate simulation on the complete device?

    E.g. could the same executable which shows the failure on a device be run in a simulation of the complete device to see if that replicates the hard fault and then trace the actual instructions executed by the Cortex-M4 leading to the hard fault?

  • Hello Chester,

    Chester Gillon said:
    Given some of the examples which show a failure after a number of seconds on a device by just using timer interrupts and GPIO toggles, i.e. without any dependencies on external inputs, do TI have the ability to run a cycle-accurate simulation on the complete device?

    I wish that were an option, but the simulation database for these devices is in archive. But even without that, the design of these devices was done many years ago and we do not have the expertise within the team anymore either from a tool chain standpoint. So unfortunately that is what is really tying our hands here as far as truly understanding the root cause since we are only able to debug the hardware as it executes code.