This thread has been locked.
If you have a related question, please click the "Ask a related question" button in the top right corner. The newly created question will be automatically linked to this question.
Tool/software:
I have a breakpoint set at a function call. When stopped at the breakpoint, clicking Run does not restart execution, I have to click Stepover and then click run. Odd problem so I made a video.
https://youtu.be/tqlLLmlxSF4?si=8OO-oGwOqo6BCJnq
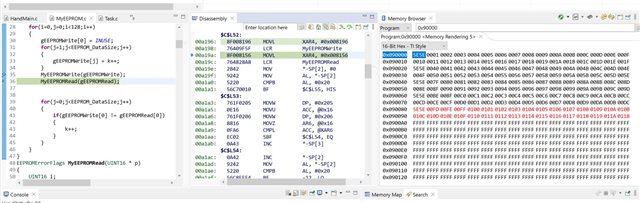
I have a breakpoint set at MyEEPROMWrite(). I click Run several times but execution stays at the same line. When I click StepOver MyEEPROMWrite() executes, the data in the Memory window updates and execution moves to the next line. Clicking run now runs the rest of the loop and stops at MyEEPROMWrite() and the behavior repeats.
I have rebooted a couple of times and checked for updates. My or may not be related to the other problem I posted with breakpoints getting lost when resetting or reprogramming the processor.
Thanks
Part Number: TMS320F280037C
Tool/software:
When restarting or reprogramming my processor while in the debugger, existing breakpoints no longer work, they still appear in the Breakpoint window but execution does not stop. I must delete and reset the breakpoints.
When I delete the breakpoint, either by double-clicking on the breakpoint icon in the code window or from the breakpoint window, I get this error:
C28xx_CPU1: Trouble Removing Breakpoint with the Action "Remain Halted" at 0xa141: (Error -1066 @ 0xA141) Unable to set/clear requested breakpoint. Verify that the breakpoint address is in valid memory. (Emulation package 12.8.0.00189)
Any solution or workaround for this problem?
Thanks
Don
CCS Version:
Version: 12.8.0.202407141830
Build id: N202407141830
This function is running in RAM. I guess the breakpoint is overwritten when the application loads RAMFUNCS.
Hi DTruex,
I'll get back to you tomorrow about this, thank you.
Best Regards,
Aishwarya
Hello,
The appropriate expert for this question is currently out of office, returning on Monday 9/16. Please expect a response back by then.
Thank you,
Luke
Hi DTruex,
Is this a interrupt service routine? (EEPROMTestWrite) If so, when clicking run and if an interrupt has happened again by the time you hit run again, it will run to the same line that you have set a breakpoint at.
Best,
Ryan Ma
EEPROMTestWrite() is not an ISR (the function declaration is visible in the video).
If it was in an ISR would the behavior you describe sounds like the debugger allows interrupt nesting even if it is disabled?
Thanks
Hi DTruex,
Okay just wanted to confirm. Do you have any other breakpoints set like ESTOPs in the code or other hardware breakpoints? Is that the only breakpoint that is set there?
If it was in an ISR would the behavior you describe sounds like the debugger allows interrupt nesting even if it is disabled?
The debugger should allow for interrupt nesting if you have that enabled.
Best,
Ryan Ma
Hi DTruex,
Can you send some screenshots of the disassembly? What happens after you press play in the dissembly view? Does this behavior occur every time you load the program and debug?
Best,
Ryan Ma
First screenshot is before and after clicking run. There is no change.
This is after clicking stepover. Notice that data in memory browser has changed indicating that EEPROMWrite() was called.
This is appears to happen every time I load and debug the project.
Hi DTruex,
Let me reach out to our CCS owner on this. Please allow me another day to discuss.
Best,
Ryan Ma
Don,
I would recommend doing a power on reset to clear this error. I have seen this error in one past project, and this is the step that I take. You can also try to clear all the breakpoints and add them again.
Best Regards,
Aishwarya
This does not have any impact. This problem is present consistently after numerous reboots of the host computer and the embedded system. I have seen the transient problem you describe with other processors such as 280047, usually rectified by restarting CCS or rebooting the host computer. With this processor, it seems to be always present. I have another thread regarding running after hitting a breakpoint in RAMFUNCs, I don't know if they are related.
Don,
Can you refer to these guides and see if these steps help with your issue?
Best Regards,
Aishwarya
I don't see anything relevant in the suggested reading. Again, this problem is isolated to functions running from RAM that use software breakpoints. Also, there is no problem setting breakpoints. The problem occurs when the processor is rebooted or reprogrammed. All breakpoints set in RAM functions no longer work and must be deleted and reset. The 1066 error occurs as the breakpoints are deleted.
This only mention of error 1066 in SPRACFOC is here:
This appears relevant for hardware breakpoints only.
Thanks
Don,
Thanks for confirming. Is this breakpoint you are referring to the same one as the other post? If so, let's join the conversation, and loop in another CCS expert.
Best Regards,
Aishwarya
It's the same project so these are probably related. I did not realize the other problem was related to breakpoints until I noticed clicking run did not restart code execution. I have a third conversation regarding debugging in the CLA that is also likely related. I assumed clicking run was executing the loop and returning to the breakpoint when it was not. I was focused on troubleshooting my code and hardware and did not realize that code was not running.
Hi Dtruex,
I am asked another team member internally if this issue has been found before and it looks like there is an ongoing ticket on this issue.
I can provide an update as the team finds a solution to this.
Can you provide the project that causes this issue?
Best,
Ryan Ma
I can send you the project, how should I do that?
Is this issue listed in the silicon errata or is it a CCS issue?
Thanks
Still need more details, but if you can zip up your project and send it over that would be great.
Best,
Ryan Ma
Hi DTruex,
Please send it to me and I will forward it on the ticket we have.
Best,
Ryan Ma