


Part Number: TMS320F280049C
Other Parts Discussed in Thread: TMDSHSECDOCK
Tool/software: Code Composer Studio
Hello,
I'm using the F280049 controlCARD Installed on TMDSHSECDOCK with Code Composer Studio Version: 9.1.0.00010 .
I would like to understand how to easily debug the CLA. To do so, I used the cla_ex3_background_nesting_task project. Then I added some variables placed in differents RAM (CPUTOCLAMSGRAM, CLATOCPUMSGRAM, shared LSRAM between CPU & CLA, LSRAM only for CPU). These variables are incremented at each loop in the Cla1Task1 function or in the main loop as you can see in my code below.
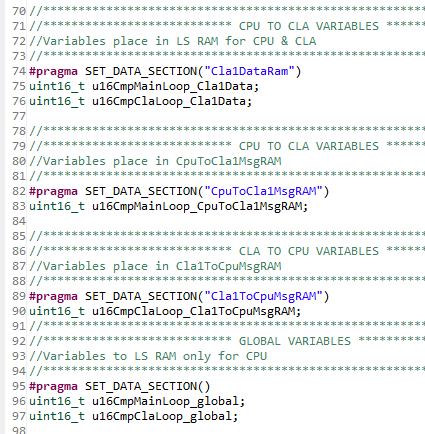
variables declaration
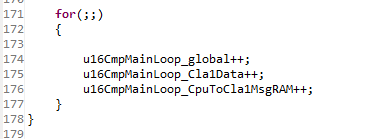
main loop
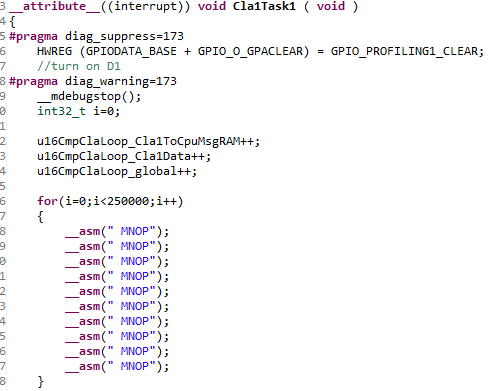
Cla1Task1
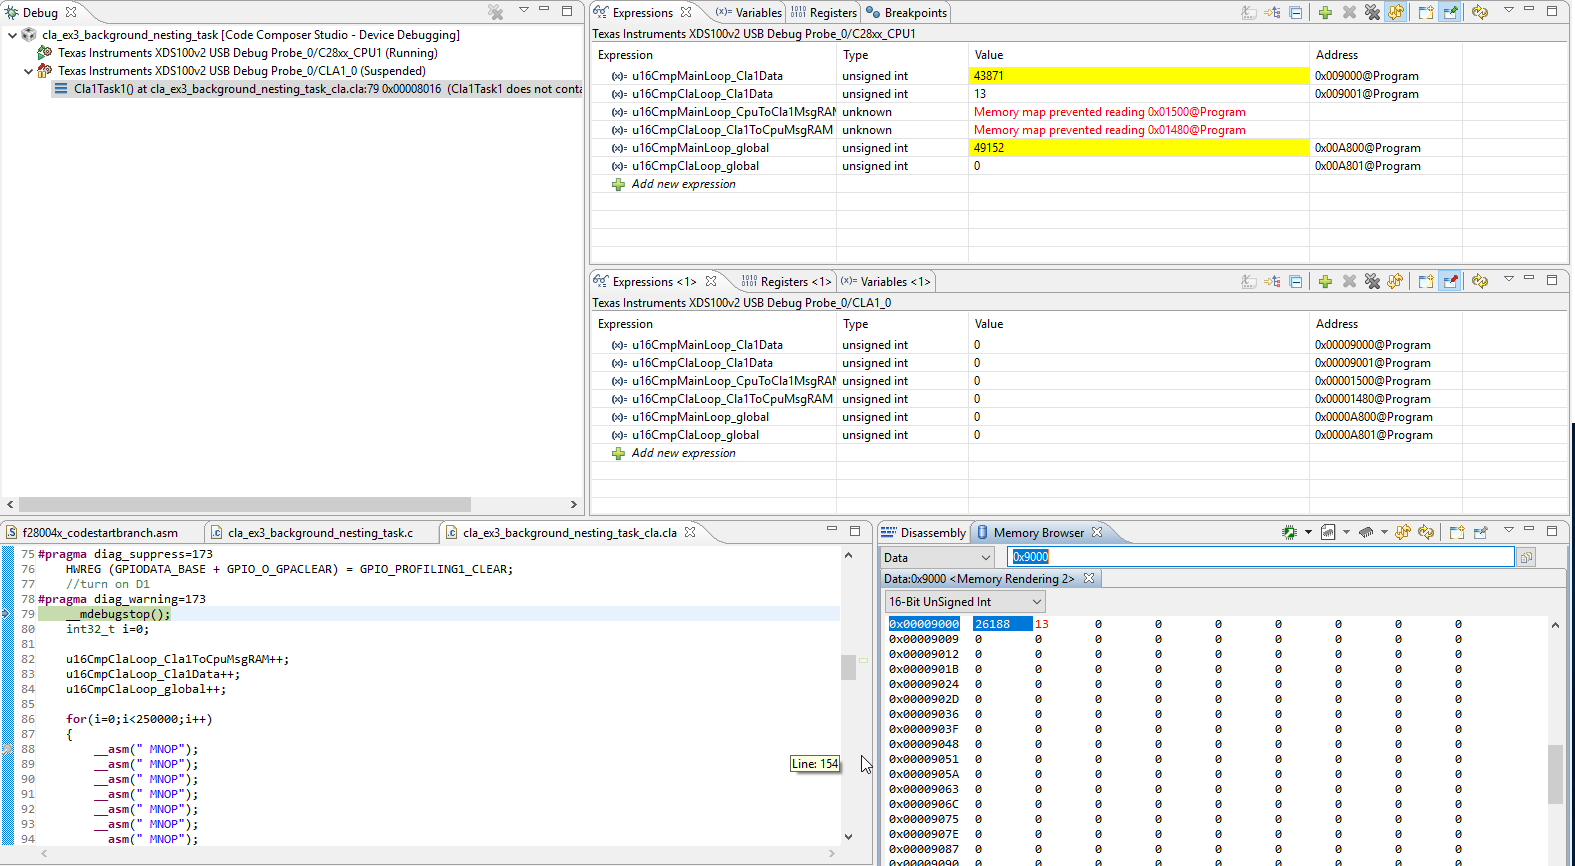
Then I tried to visualize the variables in debug mode with the Expressions windows (after connect and Load symbols). One Expressions windows is link to the CPU debug context, another one is link to the CLA debug context. I also visualize the RAM with memory browser at different address @0x1480 (MSGRAM start address) or @0x9000 (start address of RAM LS2 ->Cla1DataRam)
I could display variables in real time on CPU debug windows almost as expected. However, I could not display variables on CLA debug windows even in step by step mode. However, I could access to memory with the memory browser. Please have a look at the picture below.
Is it the expected running mode or I forgot something?
Why could I not display the MsgRAM?
Thanks for your help.


