Part Number: TMS320F28379D
I'm currently trying to debug why an ITRAP is occurring on the F28379D chip we are using. Here are some things to consider:
- I press the Debug "bug" button to flash both CPU1 and CPU2 consecutively as that is how I've setup my debug configuration
- Once the code is loaded onto both cores I press the resume button on CPU1, then on CPU2, and immediately after resuming CPU2 the ITRAP is triggered on CPU1
- The Debug window shows that Interrupt_illegalOperationHandler() is the specific ITRAP being called
- The interesting thing is that the ITRAP only occurs once. What I mean is if I press the CPU reset/restart button for each processor and then resume CPU1 and CPU2 again, the ITRAP does not occur. However, if I stop the debugging entirely by pressing the stop button and re-debug both cores it will occur again.
- The ITRAP was introduced in a recent commit, however, nothing I've seen in that commit suggests why the ITRAP occurs
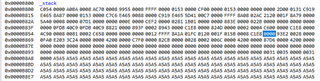
- I fill the stack with values upon startup so I can observe the stack memory when the ITRAP occurs, however, nothing indicates that the stack is overflowing
- I also tried increasing stack size from 2048 to 4096 on CPU1, but this didn't resolve issue
- I have a suspicion it may have to do with memory, the memory differences between the previously working commit (no ITRAP) and the faulty commit (ITRAP) is the following:
- RAMLS0_1 increased from 2653 to 2680 (TI ramfunc)
- FLASHB increased from 8186 to 8192 (max size)
- FLASHD increased from 8189 to 8192 (max size)
- FLASHE increased from 10511 to 11637
- RAMGS0 increased from 2903 to 3683
- As recommended in another forum post I tried to add a return; statement right after the ESTOP0; in the Interrupt_illegalOperationHandler() function, but for some reason the debugger skips the return and continues looping forever in the for(;;){;}
- Perhaps I was editing the wrong driverlib file, I modified interrupt.h in C:/ti/c2000/C200Ware_3_04_00_00/driverlib/f2837xd/driverlib
Please advise on how I may debug this ITRAP condition further. Thank you!