This thread has been locked.

If you have a related question, please click the "Ask a related question" button in the top right corner. The newly created question will be automatically linked to this question.

MSP430F5529: CCS Debug Window Slowing Micrcontroller Clock

Part Number: MSP430F5529

1)This Problem is Regarding the Debug Mode of Code Composer Studio

2)I Have Written a normal Code for PWM at 10KHz and it is working Fine, This Code uses MCLK as the Clock source which is by Default Configured to Operated at 1MHz as Mentioned in Datasheet at page Number 162.

3)In This Default Configuration of Clock i have Successfully ran codes of UART I2C PWM and faced no issue during debugging also.

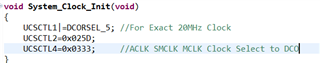
4)The Problem Started when i Changed the Clock Frequency to 20MHz, I have Verified MCLK, SMCLK and ACLK by Outputting the Clock to Pin 7.7,2.2 and 1.0 and are properly configured as I have set them and Verified it against Oscilloscope.

5)Now After the Changed Clock Frequency when I Tried all codes there were showing one Similar Problem, All codes worked Properly when I was not in debug Mode, But when i was in Debug Mode, The Code Did not work for this problem i will refer only to the PWM Code.

6)Without Debugger my PWM Code was working Perfectly fine and generating PWM at 10Khz and Variable Duty Cycle, When i Switched to debug Mode, The PWM Frequency Dropped Significantly to 100Hz.

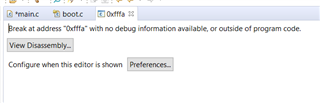
7)I Then Realized that this slow Down is Caused by Debug Mode because in this Condition i Check the SMCLK MCLK and ACLK and all were Running at 32KHz(WHY), When I Tried the Free Run Mode, The same Problem occurred but, when i Pause the Code in this Free run mode and pressed the Pause Button, The Debugger Stopped the Code Execution in Boot.c file, After Pressing Play Button the Code worked fine as it was running without Debug Mode.

8)I Repeated this Step Multiple times and every time i found the Code working in Debug Mode even with breakpoints Properly without any issue.

9)When I Executed the Code step by Step after starting debug in Free run Mode the following Files were opened During the Code Execution before starting the Execution of Main as shown in the Image.

Please Note:I am Doing all the Testing on MSP430F5529 Development Board.

10)Now I have Multiple Questions

a) Is There a way to solve this problem of Clock

b)How to Setup the Debug Window for Clock Other than default Clock Which is 1MHz

c)Does the EZ FET Emulator somehow effect what i am trying to do.

d)What are the Conditions in which Boot.c is executed.

  • Hi Nikhil,

    This is odd. The EEM (embedded emulation module) on the F5529 supports all clock frequencies.

    Let me check with our tools team on this behavior.

    In the mean time, let's look at how you bumped your clock up to 20MHz.

    By default, the core voltage level = 0.  This works for 1MHz clock.  When you bumped up to 20MHz, did you increase the PMMCOREV = 3?

  • Hello Dennis,

    1) I Was Unaware about Power Management Register you have Mentioned Above.

    2) This is How I Changed My Clock Frequency to 20MHz

    I Did not configure any of the Register you have mentioned.

    3)I Tried Modifying the Value of this Register But the Code Doesnt seem to work either way.

    4)Also I Have Been encountering the Problem sometimes in Debug Mode (Screen Shot below) But when I execute the Code without Debugger My Code Did not have any problem as I Was Able to get Data Continuosly from an I2C Sensor and Send it through UART it works without any break or error outside debug mode.

    Here The Code had Halted (*By me when i pressed pause button) at address 0xffffa, this is just one of the Address everytime i have this kind of problem address is different Every Time.

    5)Please Note: i Have only Added the Following line as Suggested by You 

    PMMCTL0|=0x0003;

    Awaiting your Reply.

  • Hello Denning,

    1) I Have Read the Power Management Module Again and I Saw that It Requires Unlocking For Modifying the Bits (Which I Did Not Do Earlier)

    2) The Datasheet Has provided a C Function Directly to Set the Core Voltage.

    3)After Directly Copying the Function and Setting the VCore to Level 3 According to User Guide Page Number:107 SetVCoreUp(3) I was Able to Run My Code Properly without any Problem Several Times.

    4)But I Still have One Doubt why Does the Code Run properly when I am not in Debug mode. And Also i think the Datasheet should mention this Thing in Unified Clock System Register Setting because I Directly Configured the Clock Register and Did not See the Power management Register.

    5)Also Please Tell me the use of Free Run Setting in Run Options in the toolbar Above. What is the Purpose of It.

    6)Lastly Thank you Solving the Issue. 

  • Hi Nikhil,

    Regarding the code operating correctly without the debugger connected, there is mostly likely some interaction between the EEM (emulation module) and the clock system that is not well supported when operating @ Vcore level 0.

    The free run option is described in the CCS user's guide.  I copied here for convenience.

    Glad to help.

  • This Does not seem to find the root cause of the problem.

    I am getting this error in Debug Mode a lot of Time, break at Address 0x0XXX with no debug information available please tell me how to resolve this.

    Also the Boot.c file is also opening a lot of times (times refers to the number of times is power cycle the Debug window).Because of this again sometimes i am unable to start proper debugging of my Code please help me resolve the Problem of boot.c.

    Also my code works every time whithout debugger once it is correctly coding. The Problematic Debug window is slowing Down My Development time.

    Waiting for Your Reply.

**Attention** This is a public forum