This thread has been locked.

If you have a related question, please click the "Ask a related question" button in the top right corner. The newly created question will be automatically linked to this question.

MSP430FR5043: USS GUI with MSPFR5043

Part Number: MSP430FR5043
Other Parts Discussed in Thread: MSP430FR6043

Hi Team,

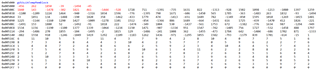
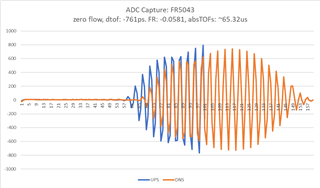
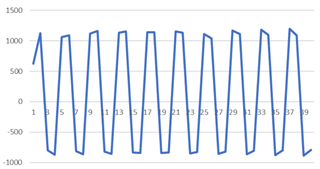
We are trying to run the USS Water Demo on MSP430FR5043. We have modified the project as given here:  link. However, we are seeing random values reflected on USS GUI's ADC Capture, the Capture window doesn't respond, always 0 on all waveforms. We are testing this with transducers kept in still water. What could be causing this? What part we have to modify it for GUI to work? As seen in some of the threads, some users have successfully used USS GUI with MSP430FR5043.

Regards,

Kamlesh

  • Hi Kamlesh,

    Could you got the normal ADC waveform if don't change(use default project)?

    Thanks!

    Best Regards

    Johnson

  • Hi Johnson, 

    Thank you for your quick response. I am using default code for MSP430FR6043. I've removed the LCD part code and changed the linker file. But, nothing on ADC Capture. Sometime a single line could be seen. Also, clicking on 'Capture' leads to continuous I2C interrupts (checked through debugging mode in CCS).

    Regards,

    Kamlesh

  • Hi Kamlesh,

    Attach the change guide from FR6043 to FR5043 as your reference:

    5557.MSP430FR5043_SW_Changes.zip

    You can follow this guide to change your project and try again.

    And I find some error in GUI, you have to see those error and resolve this in order to get noemal waveform.

    Thanks!

    Best Regards

    Johnson

  • Hi Johnson, 

    I am getting the below graph at Zero Flow. Nothing on ADC Capture. I could only get these values after lot of connection-disconnection of USS GUI to the PCB. The error tab in the above post shows high number of errors (actually, I could reproduce the same - The number of errors is updating 500 per update in error tab). The errors are "no signal detected in UPS or DNS ".

    As you can see, the DToF values are not correct. The error tab initially showed HSPLL error (code 30) then no error. After some time the waveforms stopped (seemed like GUI hanged).

    Any ideas to diagnose the exact issue?

    Regards,

    Kamlesh

  • Hi Kamlesh,

    I think the GUI communicate(I2C & IRQ) should be normal if you got some data here.Thus I think your measurement circuit maybe have some issue.

    The errors are "no signal detected in UPS or DNS "

    For this error, you need to check if HSPLL and external crystal(8MHz, maybe 4MHz)  is normal.

    And you can try to capture some waveform inCHx_OUT and CHx_IN pin, you should be able to get some normal waveform in those two pin.

    And you can follow the below information to diagnose your issue:

    file:///C:/ti/msp/USS_02_40_00_00/USS/docs/UserGuide/UserGuide/ch_errors.html

    Thanks!

    Best Regards

    Johnson

  • Hi Johnson,

    Thank you for the response.

    The HSPLL error is not coming now. Only once I could see that. However, the error is showing increase in error counts by 500 per update with the error "no signal detected in ups and dns" . When I put the PCB in debug mode and step through it. Then the error codes are updating by 1 at a time (as expected)

    Are there any settings to be changed in "Meter Options" in USS? I had chosen "custom PCB " and "MSP430FR5043" in the same. But with no success  I feel, something needs to be changed on the MSP code side as well - apart from the changes suggested earlier.

    This is what I am getting on the ADC Capture. Few random lines I can see. Note that I've clicked the "Capture" once and ADC waveform continuously updates.

    My schematic of the analog part is as follows:

    Please recommend the way forward.

    Regards,

    Kamlesh

  • In addition to above:

    To check whether the ADC is able to capture signals properly, I connected function generator with 2Vpp Sinewave generated to CH0_IN. I am able to see the data on Memory locations between 0x005000 and 0x0052CE (for both channels). It seems correct data because when I change the FG connection to CH1_IN, the relevant section of memory block populates with Data (can be seen in memory browser). Am I missing something? Now the question is how to see this on USS? 

    Regards,

    Kamlesh

  • Hi Kamlesh,

    Have you tey ro capture some waveform in CHx_IN pin use oscilloscope?

    And you can use figure function in CCS to see your ADC data to check if ADC is normal.

    Thanks!

    Best Regards

    Johnson

  • Hi Johnson,

    Yes, I connected a function generator and could see the captured data in the memory browser (picture posted in above reply - UPS Channel connected to FG). So, it seems that ADC is fine. 

    Regards,

    Kamlesh

  • Hi Kamlesh,

    Got it, it means that your ADC and communicateion circuit is normal, thus maybe this issue ia cause by transducer.

    Can you see the normal waveform in transducer pin?

    Thanks!

    Best Regards

    Johnson

  • Hi Johnson,

    So, I connected the transducers (kept in static flow) and did an ADC capture. After this, I plotted the data captured in LEA memory - This is how the graphs looks (as I am not able to connect to GUI): 

    So, overall the capture looks fine to me. One thing which is of issue is the high values of DToF, absToFs and flow rate. The ideal values of zero flow drift (around 25ps) is nowhere near to the values I am seeing here. 

    I am okay, with GUI not connecting for now, but this is a more serious issue. How can I resolve this issue? Where can be the issue? Is there a difference in algorithm or configuration between FR6043/47 and FR5043?

    Regards,

    Kamlesh

  • Adding to above:

    The above graph is when I connect the FGen generating 977kHz 1Vpp sine wave - on one of the channel. Looks okay to me.

    Regards,

    Kamlesh

  • Hi Kamlesh,

    I find the blue wave form just have half of red waveform, Looks have some issue here.

    The algorithm configuration should don't have difference for FR6043 & FR5043.

    Looks very stranger, I think you should be able to connect GUI from previous information.

    Thanks!

    Best Regards

    Johnson

  • Hi Johnson,

    The Blue waveform is half because I just copied few initial samples for the UPS, otherwise it would have showed up like the red one. I just wanted to see how the values are looking. I will try feeding in exactly same signal array values in FR6047 and FR5043 and see if any difference comes up in calculations.

    Regards,

    Kamlesh 

  • Hi Kamlesh,

    Emailed to you, discuss offline.

    Thanks!

    Best Regards

    Johnson

**Attention** This is a public forum