This thread has been locked.

If you have a related question, please click the "Ask a related question" button in the top right corner. The newly created question will be automatically linked to this question.

EVM430-FR6047: EVM430-FR6047 zero flow volume

Part Number: EVM430-FR6047
Other Parts Discussed in Thread: MSP430FR6041, MSP430WARE, MSP430FR6043, MSP430FR5043, MSP430FR5041

Hey !

I tried to get good results for low flow measurement.
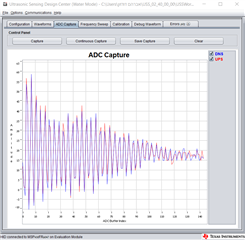
So I started the measurement when there is no water flow at all in the pipe, these are the results:

1) Why didn't I get a uniform value of zero?

2) How do I reduce the spikes that appeared in the "volume flow rate", it should be at a lower resolution

  • Hi Ido,

    1) It is very common to see this noise that centers around zero. In fact, I've never seen a measurement that sits directly at zero for zero flow. We actually recommend that customers only utilize the moving average for flow measurements. The device is just very sensitive and there are so many things that can slightly change the measurement that it is unlikely that it will ever uniformly measure zero.

    2) Related to the above, we recommend that you use the moving average. You can reduce the magnitude of spikes by refining your calibration and your hardware set up, to reduce noise as much as possible, improve the contact that the transducers make with the pipe, and choosing the best pipe material. In the end, you will still have some spikes, but these are some things to implement in order to reduce them.

  • Hi, thanks for the quick reply.
    I have already done all these things.
    I'm asking if there are parameters/values ​​related to calibration in the GUI settings that can focus me more around zero?

    I will also emphasize why this is so important, because if I get an average of 0.5 liters per hour when there is no flow at all - how will I know to differentiate between leaks or no flow?

    Therefore, I must focus more on the measurement, which will be around 0.02 liters per hour when there is no flow, otherwise the product is ineffective for detecting small leaks.

  • For a parameter that focuses you more around zero, please see advanced parameters->Delta TOF Offset. As the name implies, this applies an offset to your dToF, allowing you to center the dToF/VFR around zero when there is zero flow.

  • I found this parameter, I didn't mean it because the spikes in the values ​​are still high. I mean I want to see the graph of the flow on a scale of 0.5 liters per hour and not on a scale of 1 liters per hour as I sent you a picture.
    I want to make the measurement more accurate so that there will not be such high spikes.

    Another question, is there a driver that can be used to communicate with the MSP?
    Where can I read and download the driver?
    And is it possible to communicate with the MSP using the SPI protocol?

  • The graph scales automatically to fit the amplitude of the signal. If you want to collect the data for more detailed viewing, you can export it to CSV and have more flexibility. If you want to reduce the spikes, you will need to fine-tune your calibration settings and observe what works best for your case. You can also try to ensure that your hardware set-up mitigates noise and gives you the best signal transmission possible. This includes making sure that the transducers are making good contact with the pipe, putting the device in a low noise environment, and more. It is up to you to determine how much to do to mitigate noise and "clean up" your readings.

    When you say this, I assume that you mean something to allow you to communicate with another device via SPI (or UART, I2C, etc.), considering that you are already using the MSP430->PC interface with the GUI? For an example with UART already integrated, you may want to look at the USS Template example, which is found in the same directory as the USS Demo. We have examples that use SPI communications but do not already incorporate the USS code, so it will be up to you to build the final project that does both. These examples can be found in the MSP430Ware SDK under [..]\msp430ware_3_80_14_01\examples\devices\MSP430FR5xx_6xx\MSP430FR6043_MSP430FR6041_MSP430FR5043_MSP430FR5041_Code_Examples\C.

  • I mean, does the MSP430 component itself, not the entire EVALUATION BOARD, but only the MSP know how to communicate via SPI\UART communication?
    If so, where can I find information about his communication? And how to connect it?

    And I didn't get an answer. Is there a driver for the MSP430-FR6047?
    And in what language is it written?
    Where can I download its driver?

    I want to make changes inside the component not from the USS but from its driver

  • The MSP430 is able to communicate via SPI and UART. Please see sections 30 and 31 in the device family user's guide. Software examples can be found in the location I linked above.

    I am not clear on what you are asking for. There are many drivers for the MSP430-FR6047. If you've downloaded MSP430Ware, and the USS libraries, you have all of the drivers necessary for any application with the MSP430-FR6047. Are you asking for the drivers that support the SPI and UART modules? Or are you asking for drivers that interface your PC with the microcontroller? I can see above that you have already programmed the device and connected it to the USS GUI, so you already have all of these drivers.

    The drivers that come with MSP430Ware and the USS libraries are all that you would need to adjust your application, USS or otherwise. These are all linked in your project. You can edit them in CCS or whichever IDE you have selected.

  • At the end of the process I want to calibrate the system remotely.
    Literally calibration from 0.
    How would you suggest doing it?

  • By remotely, I assume you mean through the serial interface? You could do this by putting the device into BSL mode and reprogramming it with the calibration values you want. 

  • I mean I don't need a physical connection between the MSP and a computer (like now when I connect the EV to the computer)

    I want to leave the set-up in a certain place and then remotely change values ​​of the calibration and read data remotely

  • The MSP has no built in wireless functionality. So if you'd like to program it remotely, you'd have to add some other wireless MCU to program it over BSL. 

  • I understand.
    I'm getting a little confused, I'd appreciate it if you could help me understand again how to communicate with a component not with the help of the GUI.

    I have these three folders.

    C:\ti\msp\USS_02_40_00_00\USS\examples\USSSWLib_template_example\USS_Config

    Here are h files.

    C:\ti\msp\UltrasonicWaterFR604x_02_40_00_00\examples\USS_Water_Demo\USS_Config

    h files exist here too.

    Which one to choose?

    After I figured out which of the folders I should use, how do I even open it as a project so that I can change values?

    After we manage to change values, how do I compile the project and load it on the MSP?

    After we manage to burn the MSP, will I see the changes during measurements or will I see it in the GUI?

    I would really appreciate it if you could answer me slowly and in detail so that I understand. Thank you !

  • Hi Ido,

    If you'd like to communicate with the component without the GUI with your computer connected to the component:

    You should open the IDE of your choice (I use Code Composer Studio), click file, import, ccs project, then browse your file system to C:\ti\msp\UltrasonicWaterFR604x_02_40_00_00, then hit select folder. Now the Discovered projects tab will display a list of projects. Select MSP430FR6047EVM_USS_Water_Demo. Now the project will populate in your project explorer. Expand the project, and expand the folders to navigate the files, and double click to open the file. Edit the file in the window. Then save, then click the build button. Now you've generated the output file for the project. Click the flash button to flash the project files to the component. Now the component is flashed with your edited project. Now all measurements you collect will be determined by the edited values you entered in the files. If you open the GUI, the default values should persist until you request an update. Once you request an update, all of the values listed in the GUI will replace the values you've programmed into the board.

    You can optionally use the GUI to fine tune your calibration values, then use the "export header" button to generate a new header file with the calibration values. Then you can replace the header file in your future projects with the header file that you generated in order to apply your calibration values.

  • Okay, first of all, thank you very much, I made a lot of progress thanks to your detailed explanation.

    I changed the METER CONSTANT value from 1.2742 to 2.742
    As you can see in the picture, I did BUILD and FLASH for the project, through the CCS as you said

    After that I opened the GUI connecting to the board this is what I see:

    The value I changed did not change at all, and there is no good ADC so it cannot measure flow values.

    Secondly, I don't find many parameters in this file, for example:
    gap between pulse start and ADC, num of pulse, ect..

  • Hi Ido,

    I am glad to hear that this was helpful.

    As for the GUI not showing the changes you made in your code: this is expected. The calibration values that are shown in the GUI by default are not necessarily the ones programmed to your device, particularly if you edited the values in the file before flashing the device (as you have done). The calibration values that you first flashed to the device will remain there until you hit "request update" in the GUI, and until that point, the GUI calibration data may be different than what is actually in the device.

    For your issue with bad ADC values: This is why we encourage customers to first find the calibration values that work best using the GUI for calibration. Once you've found the values that work best, you can generate and export the headers with all of the correct calibration data so that you can utilize them in your project.

    Finally, to address not being able to find these parameters in the file: You should take a look at the USS Design Center User's Guide. This page shows all of the calibration parameters, their typical ranges, a short explanation of what they do, and it shows what values in the code correspond to in the GUI. I think you will find this page very helpful, especially if you want to edit the calibration manually in code.

  • I was able to use headers and change a value and see it in the measurement!

    1) Is there a way to perform automatic calibration?
    Know someone who has done this? Have you come across such a question?
    I want to mount it on pipes of different diameters, and of different materials and perform an automatic remote calibration, now as soon as I change actual components of the system the ADC will be affected, and the VFR calibration is also different (what you once directed me to do, to calibrate for several types of flow) so I'm a bit stuck here. .
    You have an idea ?

    2) When I use the GUI and change a parameter and perform an "update request" does it burn and perform a flash on the board?

    Is it possible to update TOF parameters without burning each time?

  • This is great news, I am glad things are starting to work for you.

    1) Automatic calibration is a tough problem. While it is probably possible, I think this would be very complex. Here at TI we have not developed an automated process for verifying the ADC capture, ToF data, and meter constant for calibration. This would require your computer to recognize all of these things, then optimize them. I would not say this is impossible but this would be quite difficult. We normally expect customers to perform calibration with one hardware set-up, or a small number, and then this calibration is applied to all of the same hardware.

    2) The GUI does not flash the device every time you request an update. It sends the parameters that you've entered to the device via the HID bridge, which the device then uses to adjust the variables for each parameter.

  • Regarding question 2
    Is it possible to change TOF parameters without the GUI?

    Like we did with the CCS but without burning the card?
    But change it and it will be directly updated on the MSP?

    another question, Can you advise me how to measure the current accurately?
    What to connect to Jumper 32?
    DVM? SCOPE?
    I want to say low current consumption as you describe of 3uA

  • When you say ToF parameters, do you mean the calibration parameters? I am unsure what you mean by this. However, if you'd like to change the calibration settings without the GUI, you will need to flash the device again. Or you could completely write your own project to do this but this would be very time intensive and I would not be able to offer much support on this.

    For measuring current consumption, please see sections 1.2.1 of The EVM430-FR6043 hardware guide.

  • We said that there are two options to update parameters on the MSP
    1) With the help of the GUI and it does not burn on the card
    2) with the help of CCS and it does burn on the card

    I am asking if it is possible to change parameters not with the help of the GUI and while the component is working? without burning it?

    Regarding the current measurement, I know how to measure.
    I connect a DVM between the two points of jumper 32
    The problem is that I get a consumption of 180u when there is communication between the sensors
    And when there is no communication between them I get 3m.
    Is the phenomenon familiar to you?
    Another question, how do I reach a current consumption of 3u as you describe in the datasheet?

  • Ido,

    In this case, what I said above is true and you are limited to those two options.

    As for the current consumption: The 3uA figure quoted in the datasheet is an approximate value that you would see when collecting 1 result per second. This current consumption will change when you utilize various transducers and various settings. a spike of 180 uA during measurements would not be extremely surprising to me, but 3mA between measurements should not occur. Can you describe/post an image of your test set-up? Have you changed the code beyond any of the settings for finding ToF?

  • First of all I flashed the card using this image file:

    Then I measured this way:

    In the first picture there is communication between the sensors, you can also see that the D202 bulb is off

    In the second picture, there is no communication between the sensors, so the D202 bulb is on


    1)Is the measurement method correct?

    2)How do I know how many measurements per second it is sampling? In the image burned?

    3)Is it possible to export flow data from the GUI?

  • 1) Your set up does look correct.

    2) The time between measurements is the UPS0 to UPS1 gap in the USS GUI.

    3) Yes you can. Please see the USS Design Center User's Guide section on logging for this.

    D202 should just be blinking once per second to indicate that the connection to the HID bridge is good. It does not indicate that the device is currently transmitting. 

    You should take a look at this document that describes current consumption for this device. It seems that spikes up to 2.82mA are to be expected. Viewing the exact current consumption using a DMM is going to be difficult. The average current consumption should be around 3uA under a specific set of conditions.

  • And a lot of things are starting to work out - thank you very much!

    Is there a limit to the number of samples?
    In the GUI the limit is one sample per 2 seconds
    1)I want it to take a sample once a minute
    Is it possible to change this value from CCS ?
    2) Will it reduce my average current consumption significantly?
    3) Can you offer me a way to accurately measure current consumption? I want to see the actual graph attached to the document, I have a scope, but when I connect it with a 1 kohm resistor and measure voltage on it, I see unstable readings on the scope.
    I am attaching a picture

  • Hi Ido, 

    I am very glad to hear that things are starting to look better on your end.

    When you say limit to the number of samples, I assume you mean limit to the number of samples per second? There is a limit to the number of samples that you can collect per second. However, this limit is not hard-set, it is dependent on your environment and calibration. In an extremely low noise environment, with a low number of excitation pulses, you can achieve higher sampling rates. However, if there is a lot of ringing, you will have to wait longer for it to die down, forcing you to use a lower sampling rate. 

    1) You should be able to accomplish this by adjusting the UPS0 to UPS1 gap in the GUI, which corresponds to the USS_SYS_MEASUREMENT_PERIOD define in the code. You can change it in the code or the GUI, whichever you prefer. This is the gap between the upstream transmissions of consecutive measurements. As I mentioned above, this will be limited by the ringing of the transducers. Once you reduce it too far, you will start getting errors and bad measurements. 1 sample per second should be fine to implement without additional considerations though.

    2) Increasing your sampling rate from 0.5 samples per second to 1 sample per second will increase your current consumption. You can see in figure 26 on this document that the measurements consume a lot of current, and outside of the measurements the device is in a low power mode.

    3) The document we discussed above is our reference for measuring current consumption. Also, I am not sure what you mean when you say that you connect a 1k resistor and measure the voltage, could you elaborate on what you mean by this? Looking back at your images of your test set up, I see that the ammeter reads 1.2uA and 2.82mA for different times during the device's measurement period. These look correct. If you'd like to make a graph of the power consumption, You will need a more advanced ammeter that can automatically plot the current consumption. However your wiring still looks good and the general procedure will be the same, aside from the specifics of the ammeter that you choose.

  • 1) I think you misunderstood me about the first question, I mean is there a limit to a lower number of samples?
    I mean I want there to be 0.1 samples per second
    Or even less to have one sample per minute (1/60 sample per sec).
    Is it possible?

    3) Regarding this question, I changed the setup so that I can see in the scope the pulses of the current requirements as in figure 26 that you mentioned above.
    I connected the jumpers to a 1K resistor and connected the scope in parallel with the resistor to measure voltage on it
    The picture I sent is what was received.

    I asked you to advise me how I can see the pulses in a cleaner way?
    How can I see the idle current more accurately?
    Can you give me an idea for a more accurate setup?
    Or how did you measure in the lab?

  • 1) Ah yes I did misunderstand. In the USS Design Center User's Guide, we specify a maximum delay (lowest sampling frequency) of 2000ms UPS0 to UPS1 gap. In the USS GUI, you will be limited to this amount. However in the demo code you may want to try setting the corresponding define higher than 2000 to see how the device responds. I am not aware of a reason that 2000 would be the maximum. I would say test this out and see how it goes, just know that the maximum gap is still set to 2000 so I can't guarantee proper behavior beyond that.

    3) I believe that when the document was created, the writer used the set up mentioned above and just used an oscilloscope to plot the current consumption and show the current vs time on a small time scale.

**Attention** This is a public forum