This thread has been locked.

If you have a related question, please click the "Ask a related question" button in the top right corner. The newly created question will be automatically linked to this question.

MSP-EXP430FR5994: HW or SW breakpoints not working in CCS 12.7.0.00007 + msp430-gcc-9.3.0.31_win64 on Windows11

Part Number: MSP-EXP430FR5994
Other Parts Discussed in Thread: MSP430FR5994

Hello,

I have about the same issue as here (but it was on Linux, long ago) :

https://e2e.ti.com/support/tools/code-composer-studio-group/ccs/f/code-composer-studio-forum/653386/ccs-ccstudio-v7-4-0-00015-linux-gnu-gcc-v6-3-1-linaro-cannot-set-breakpoint-from-source-window

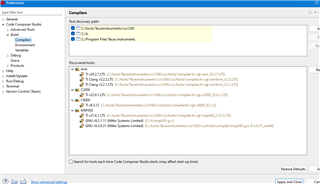
I installed GCC via the App Center of CCS.

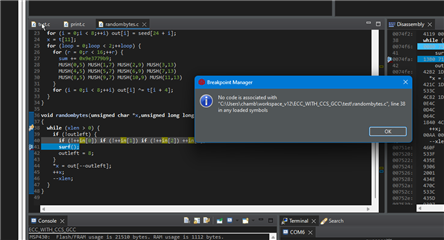
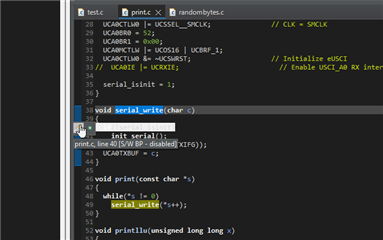
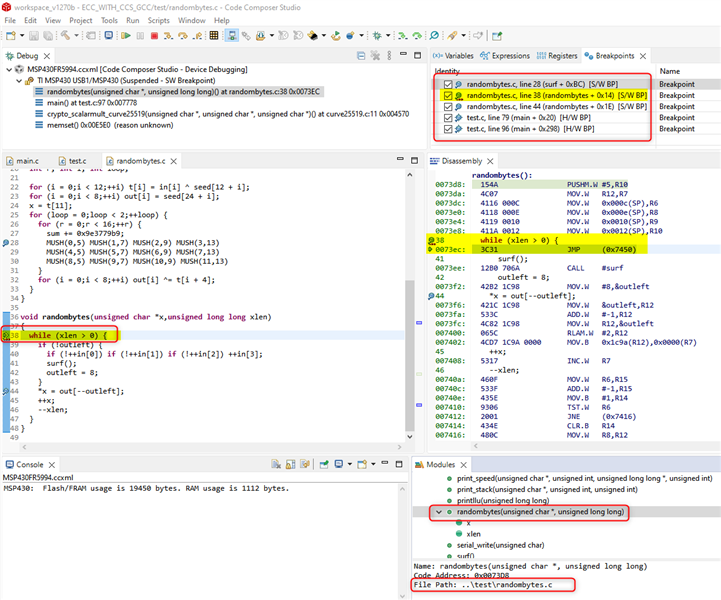
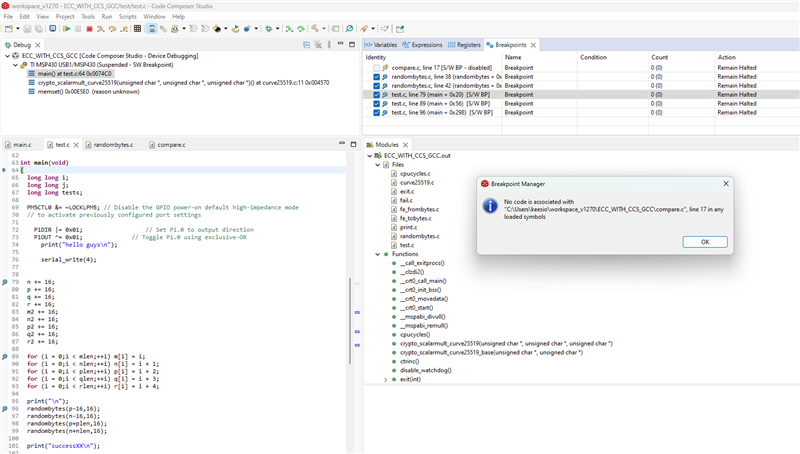
Software or Hardware breakpoint are automatically disabled and won't work during debugging session, when placed in C sources.

Only breakpoints put in disassembly window are taken into account.

I have the same message "no code associated with..." when trying to force-enable these breakpoint; whereas all my folders are well in the "source" setting of build configuration

I don't think I have any optimization either, the summary of flags set is:

"-mmcu=msp430fr5994 -mhwmult=f5series -I"C:/tools/TexasInstruments/ccs1260/ccs/ccs_base/msp430/include_gcc" -I"C:/Users/chamb/workspace_v12/ECC_WITH_CCS_GCC" -I"C:/tools/TexasInstruments/ccs1260/ccs/tools/compiler/msp430-gcc-9.3.0.31_win64/msp430-elf/include" -Og -g -gdwarf-3 -gstrict-dwarf -Wall"

I tried removing large memory model flags, without success.

Breakpoints did work when using the TI Compiler instead of GCC.

  • Dose the functions(you put the breaks) be called in the main function?

  • Yes, even breakpoints at the beginning of main() get ignored ; and run-to-line to the same lines work, on the other hand.

  • Hello,

    I have the same message "no code associated with..." when trying to force-enable these breakpoint

    There appears to be some issue with the source code correlation. Would you be able to provide the project with the issue?

    Thanks

    ki

  • Yes, thanks, here is the code of the project

    https://sharing.prolifik.net/MSP430-ECC_WITH_CCS_GCC.zip

    I managed to make a breakpoint work once in main(), without reason, but the rest of the time I get this auto-disabling of hw/sw breakpoints and the error message mentioned above

  • Hello,

    Thank you for the test case. Using CCS 12.7.0, I was able to import the project and load the executable to my FR5994 LaunchPad. I didn't see any issues with source line breakpoints:

    Can you close the randombytes.c file in the editor, then see if you click on the "randombytes" function in the Modules view if that opens the correct file in the editor.

    If you have never used the Modules view, please see: https://dev.ti.com/tirex/explore/node?node=A__APVIzRhtpuf-7AMAb9iu3w__ccs_devtools__FUz-xrs__LATEST

  • I tried the Modules panel, and indeed the files and functions of my code can be properly opened from here

    When setting a breakpoint in a project-root C file, though, I just discovered that it it works.
    It's as if having some C files in a "test/" subdirectory breaks their breakpoint system :??

  • I tried the Modules panel, and indeed the files and functions of my code can be properly opened from here

    Then the source code correlation appears to be ok.

    It's as if having some C files in a "test/" subdirectory breaks their breakpoint system :??

    As you can see in my screenshot, I can set source line breakpoints in ./test/randombytes.c. 

    In your latest screenshot, your CCS IDE looks a little different. For example, the tabs in the editor and some of the views have more rounded edges than the sharp square edges in my default CCS IDE environment. Are you using a different theme or perspective?

  • I'm using the default perspectives of EDIT and DEBUG, is it due to Windows 11 that panels are a bit different ??

  • I'm using the default perspectives of EDIT and DEBUG

    You mean the CCS Edit and CCS Debug?

    is it due to Windows 11 that panels are a bit different ??

    I don't think so but I will need to check on a Windows 11 PC to confirm

  • I don't think so but I will need to check on a Windows 11 PC to confirm

    Everything works (and looks) fine on Windows 11 also.

    Can you try cleaning your environment and workspace (9.4.2 and 9.4.3): https://software-dl.ti.com/ccs/esd/documents/users_guide/ccs_troubleshooting.html#general-ide

    Also try steps 9.7.3, 9.7.4, and 9.7.5?

    https://software-dl.ti.com/ccs/esd/documents/users_guide/ccs_troubleshooting.html#delete-the-debug-launch-configuration

    Thanks

    ki

  • Yes it's CCS EDIT/DEBUG perspectives that I use

    I've tried all the manipulations/reset listed above, 9.4.2 and 9.4.3 and 9.7.3 and 9.7.4, and 9.7.5

    The faulty project is now the only one enabled in my workspace, but I still have the breakpoint bug for non-root source files  :?

    I've checked my PATH; no weird mingw/gcc installs are in it, so it's not this kind of conflict either

  • When I check the Modules view, I do not see the compare.c file or compare function listed. It does not look like it was used in the build. Or at least it does not exist in the debug symbols. So the error you see would be expected in this case.

  • I have the "compare.c" file and functions in my Modules tab, and the breakpoints work fine with them ;

    It' only when I try to enable the breakpoints from test/* files, like le main() of test/test.c, that I get the error messages, whereas all these files/symbols too are well in the Modules tab.

    It is really weird  :?

    With the TI Compiler I have no problems though, it's only with GCC

  • I have the "compare.c" file and functions in my Modules tab, and the breakpoints work fine with them ;

    It' only when I try to enable the breakpoints from test/* files, like le main() of test/test.c, that I get the error messages, whereas all these files/symbols too are well in the Modules tab.

    It is really weird  :?

    It's weird, I have the reverse problem. I can't set breakpoints in compare.c and it is not visibile in the modules view. Hence I can't set breakpoints there also.

    I have no issues setting breakpoints in test.c

  • Hm there is definitely something broken with GCC in CCS for MSP430, but even if not on the same files (and with differences in the Modules panel), we have a reproducible bug here.

    What's the best way to escalate this?

  • Hm there is definitely something broken with GCC in CCS for MSP430, but even if not on the same files (and with differences in the Modules panel), we have a reproducible bug here.

    I'm not convinced there is a bug. I took a look at the example project you sent me and I don't see compare() ever called. Hence it would makes sense that it is not referenced in the debug symbols. Are you using a different example? I can step into various functions and CCS can find all the source and I can set source breakpoints in all of them. 

  • Ah, for compare.c I indeed modified the main() to call the compare() function, and thus test the breakpoint in it.

    So in your case you probably have no bug, just the normal optimizing-out of unused functions

    But on my side I can't get why main() - which IS called :D - gets this breakpoint error as if it was not available in symbols  :???

  • For us to debug the issue, I need a reproducible test case. I'm still befuddled why the source code correlation is not working.

    The below video is what I am doing:

    Have all your source files closed in the editor. Then when the program is loaded and run to main, it should open test.c and be halted in main. In the test.c that was opened by CCS, you cannot set a breakpoint on any source line like I am doing in the video? Your optimization setting is -Og, correct?

  • Yes I did exactly as you did, and my optimization flag is well -Og

    I've stumbled onto something new though, there were 2 GCC compilers found in my "Compilers" preferences, the one embedded into CCS (GCC 9.3.0), and the one I had installed separately for CLI tests (GCC 9.3.1). None of these worked with breakpoints.

    But I removed the CLI GCC package, and then breakpoints started working everywhere (not just in compare.c, but in test.c too). No more buggy breakpoints

    I readded the CLI GCC, and now breakpoints keep working, whatever the compiler I select - the internal one or the CLI one.

    I can't reproduce the bug anymore, so it seems like there was a mixup between the two GCC packages ? Something like a wrong PATH, conflicts between binaries of the two separate installs ?

    At some point I had added C:\ti\msp430-gcc to my system PATH, but for a while now it wasn't in my PATh anymore, could it be that CCS "cached" the system PATH, even through cleanups/rebuilds ?

    It's unsatisfying that the bug remains somewhere, but I guess we can conclude "if this happens, tinker with the installed GCC compilers and refresh the 'discovered tools' until it works again" ?

    Thanks a lot for the input Ki, by the way, Pray

    I guess if we can't reproduce that, I'll have to close this thread as is  ^^'

  • I can't reproduce the bug anymore, so it seems like there was a mixup between the two GCC packages ?

    If they both work, I'm not sure how the conflict is happening.

    In any case, the compilers would only be used for building, not debug. For example, I initially used the executable you provided in the zip. That was compiled on your machine at the time you saw the issue. 

    It's unsatisfying that the bug remains somewhere, but I guess we can conclude "if this happens, tinker with the installed GCC compilers and refresh the 'discovered tools' until it works again" ?

    This really does confuse me because the discovered tools list would only impact project build and not debug.

    I really don't understand why removing a compiler from the discovered list would help with debug.

    I guess if we can't reproduce that, I'll have to close this thread as is  ^^'

    I'm glad things are working for you and I wish I could provide some more definitive answer to why you saw the issues that you saw. But I have none.

    Lets close the thread for now and we can revisit if it happens again and you have more details to share.

    Thanks

    ki

**Attention** This is a public forum