


Tool/software:
When I use CCS 20.1.1 for MCU debugging, I find that there are no relevant debug configurations. Do I need to manually add the relevant debugging configurations? This seems to be automatic in Code Composer Studio 12.8.1.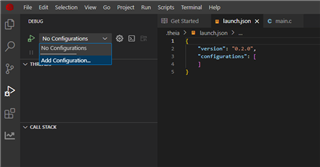
Tool/software:
When I use CCS 20.1.1 for MCU debugging, I find that there are no relevant debug configurations. Do I need to manually add the relevant debugging configurations? This seems to be automatic in Code Composer Studio 12.8.1.
**Attention** This is a public forum


